SAFe Metrics at the Team Level: Corporate Communications

blog banner: contextualizing SAFe metrics: corporate communications edition

We started this series on SAFe® team metrics with the simple acknowledgment that contextualizing SAFe metrics for a non-technical Agile team can be difficult. To continue learning how other teams adapt SAFe metrics to their specific context, I sat down with Amber Lillestolen, the Scrum Master of the Corporate Communications (Comms) team at Scaled Agile, Inc. Here’s what she shared about applying SAFe metrics for a ‘traditional’ communications team.

Applying SAFe® Metrics in Marketing for a Communications Team

Scaled Agile has a few small cross-functional marketing teams to support different business areas. Corporate Comms is one of these small teams. Their purpose is to propel market growth through a cohesive, compelling brand experience that inspires delight, confidence, and loyalty in current and prospective customers. 

The team works across the company—from public relations to customer stories and brand work for new product launches. Rather than debugging and deploying, communications professionals help simplify and communicate complex messaging, refine product value propositions, develop thought leadership content, and much more. This work requires significant cross-functional skill, research capabilities, collaboration, qualitative reasoning, and the ability to build alignment while planning for future releases. 

Their common work items include

  • Company-wide brand reviews
  • Auditing and updating brand guidelines
  • Market research
  • Developing product messaging and value propositions
  • Understanding customer needs and building messaging frameworks with other marketing teams
  • Thought leadership content development with executives
  • Public relations strategy and management
  • Material preparation for events and conferences 
  • Recruiting and curating event customer stories
  • Naming and messaging standardization across the organization 

Amber is Corporate Comms’ first Scrum Master, about four months into serving the team. Corporate Comms is a unique team because they are a shared service across the organization. This means they receive a significant amount of walk-up work from other teams. Since this type of work consistently (though not always predictably) consumes a portion of the team’s capacity, it’s important to track it using metrics. 

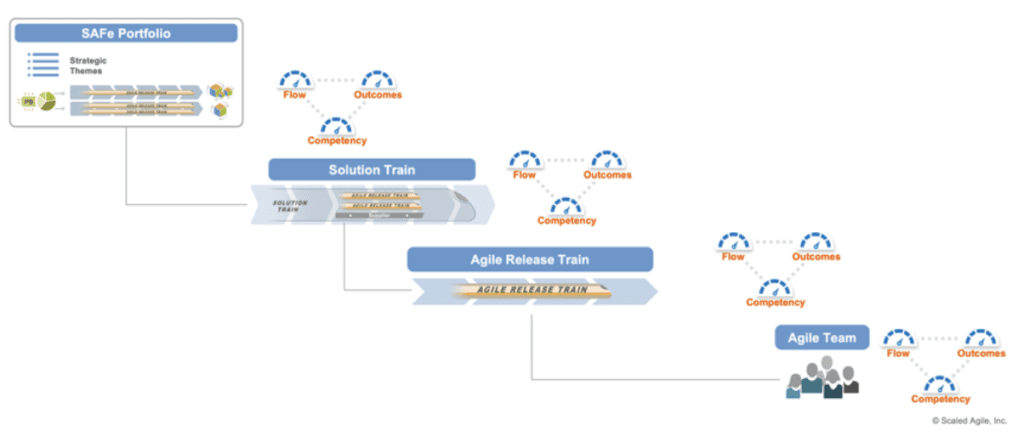
Below, Amber shares her process for tracking the team’s performance, including which metrics she uses to coach and guide the team. We separated these team metrics into the three measurement domains outlined in the metrics article: outcomes, flow, and competency.

Outcomes

Question: What metrics do you use to measure outcomes?

Outcome metric #1: PI Objectives

The Corporate Comms team reviews PI objectives throughout the PI to ensure that their related features are progressing. This helps the team determine if they are ahead, on track, or behind on the outcomes they promised to deliver in the PI.

Here’s a basic example of a Corporate Comms PI objective:  

In support of SAFe’s evolving brand, provide enablement resources for applying new communication messaging and naming to team-level assets.

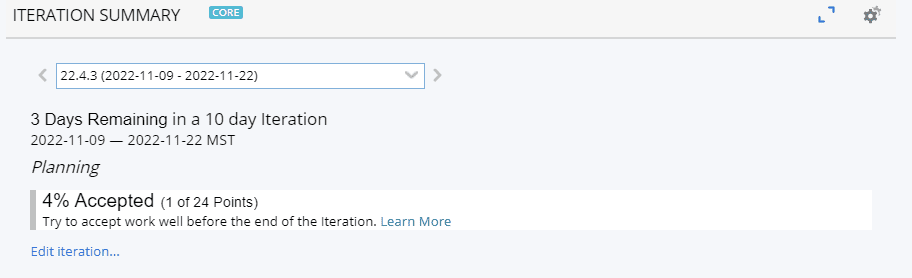
Outcome metric #2: Iteration Goals

The team creates goals every iteration and tracks their progress. They create goals related to the high-priority stories planned for the iteration.

Flow

Question: What metrics do you use to measure flow?

PI objectives

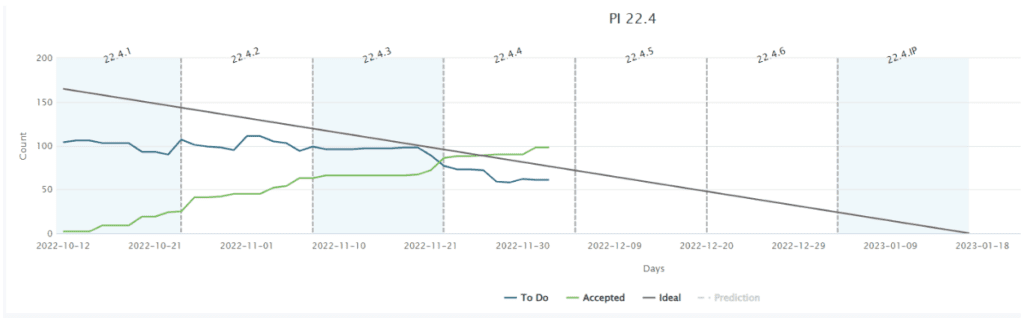
For Amber, flow is about delivering value, so she also included PI objectives under the flow metrics category. The Corporate Comms team uses PI objectives to measure its flow as part of the Operations Agile Release Train (ART). She reviews the team’s objectives during iterations to help the team understand what value they’re bringing to the organization.

If you don’t remember seeing PI objectives in the flow section of the SAFe Metrics article, you’re right. flow metrics, like predictability, show how well teams achieve outcomes like a PI Objective. 

But for the Corporate Comms team, tracking the degree to which an objective is completed functions as a handy ‘pseudo-flow’ metric for the comms team. Ultimately, their PI objectives will roll up into broader Program Predictability Measurements, but this is a good way to track flow predictability on a smaller scale at the team level. 

This is a good example of adapting metrics to meet their team needs, and simplifying their measurement process to retain its simplicity and usability. If objectives are continually missed over several PIs, this means value isn’t flowing. And value flow is the purpose of flow metrics.

Amber combines PI Objective progress with a review of the team’s velocity to understand the flow of value and completed work each iteration.

Flow Distribution and Flow Velocity

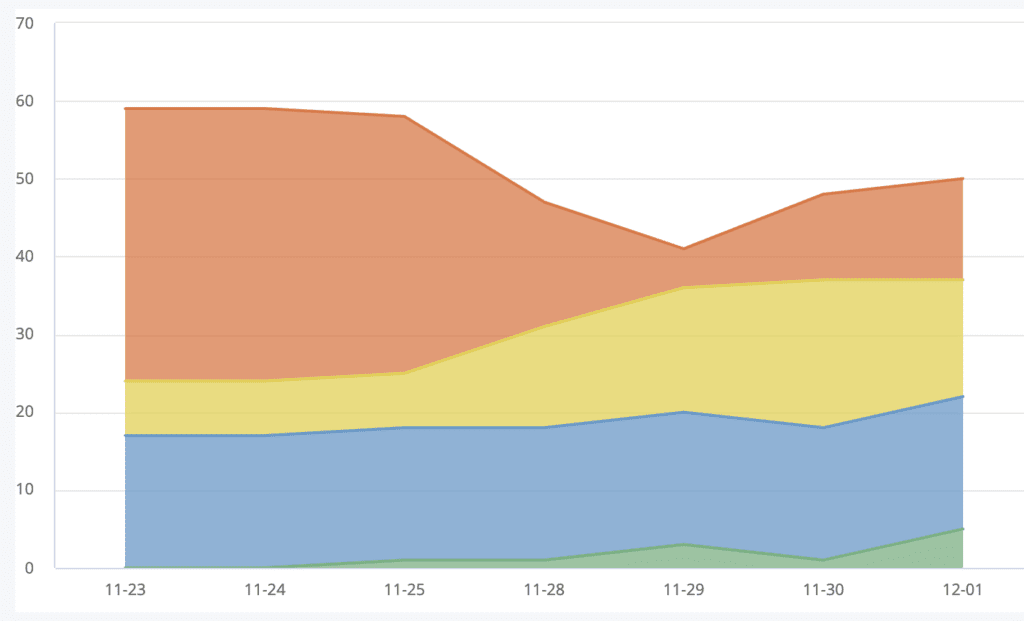
Flow distribution measures the amount of work type in a system over time, which is important for the Corporate Comms team to track.

As mentioned above, Corporate Comms is a shared services team. This means the entire organization is an internal customer of their work. As a result, the team has frequent walk-up work from other groups. Some examples of the team’s walk-up work include:

  • Booth designs for domestic and international events
  • Market research and analysis when a change occurs
  • Reviewing other teams’ slide decks and presentation materials

Because this walk-up work is a regular occurrence for the team, they reserve some of their capacity for it each iteration. It’s important for the team to see how their work is distributed across planned and unplanned work so they know how much capacity on average to reserve for walk-up work each iteration. 
They track their capacity in an ALM tool using the following views:

screenshot of Iteration Summary view in Rally
Iteration Summary view in ALM tool
Screenshot: Team planning view in Rally
Team Planning view in ALM tool
Screenshot: Team planning view in Rally
Team planning view in ALM tool (work items blurred for confidentiality)

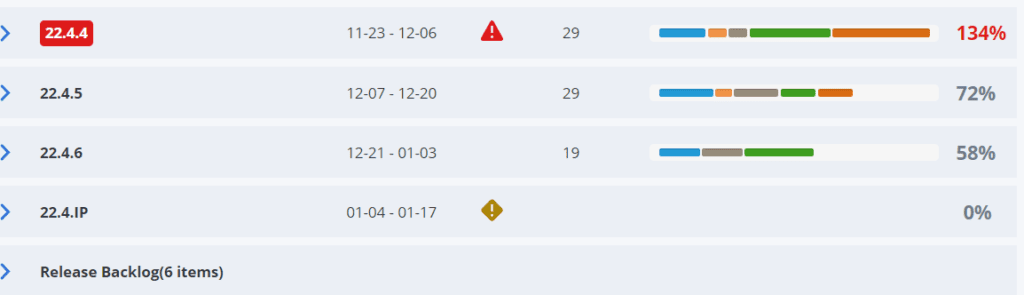
The team looks at their capacity and velocity metrics during iteration planning to see if they are over capacity. 

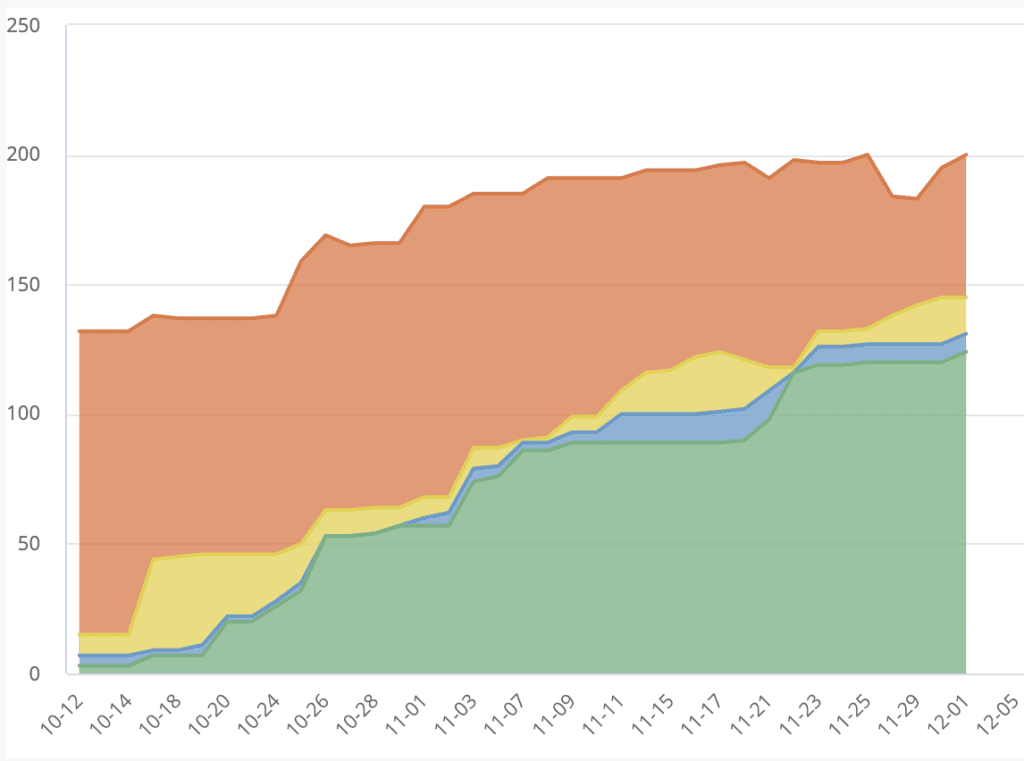
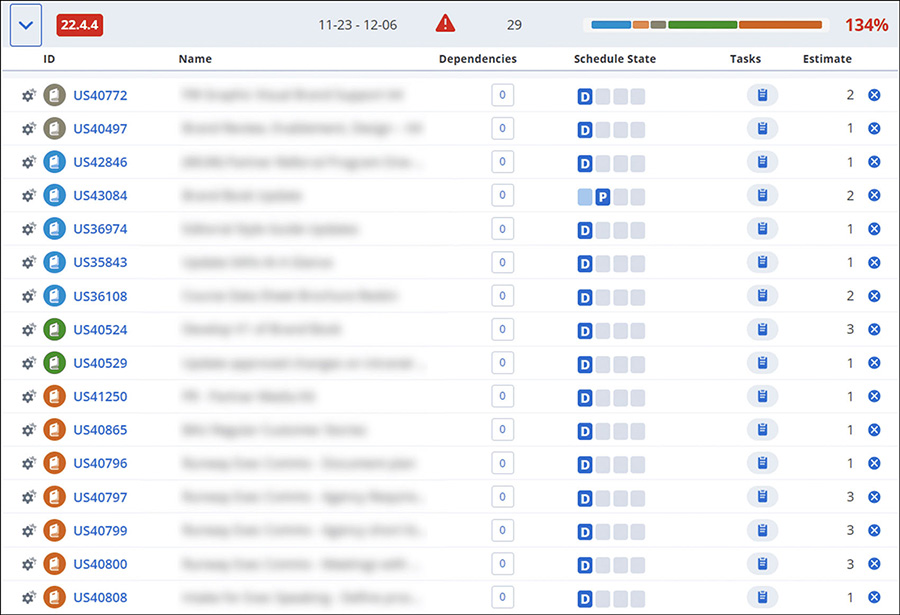
Flow velocity measures the number of backlog items completed over a period of time; in Corporate Comms’ case, this period of time is an iteration. 

They review these metrics at iteration review to see if they finished all planned work. Amber also uses the team planning board in an ALM tool to show if the team is over capacity and discuss what items need to move at iteration planning to adjust their capacity.

Using capacity metrics to move stories

If the team discovers they’re over capacity, it’s usually for one of two reasons: 

1) Long review cycles

2) Undefined work

A lot of the team’s work is tied to cross-functional changes across the business, and those carry unknowns. As strategy evolves, sometimes the work changes to match what’s new.

Marketing teams are prone to getting buried in last minute requests and repeated context switching. SAFe provides a shared language and approach to work that teams can use to define:

  • What work can be done
  • How long that work will take
  • Dependencies
  • What other work needs to move or change to accommodate priority requests

This is a helpful level-set on expectations for how other teams can protect the time and resources needed to deliver planned value.

Reserving capacity for walk-up work

Amber also tracks the work that comes in and the team adds stories for walk-up work. They use this data to measure unplanned work requests during the PI compared to the work planned during PI Planning. 

During the last PI, which was the team’s first PI Planning with a Scrum Master, Amber encouraged the team to plan to only 80 percent capacity to allow for any walk-up work. She arrived at this number based on the 20 percent of walk-up work from previous capacity and velocity metrics. 

The team also uses ‘bucket’ user stories every iteration for team members who run office hours and complete other routine work. Office hours are blocks of time reserved for people from other teams in the organization to bring items to Corporate Comms for review. These brand office hours occur three times a week for an hour. 

Any work brought to office hours that will take over two hours becomes a story with points and is added to the iteration based on urgency and capacity. Tracking their work this way creates a reliable record of capacity needed to address business as usual items, planned new work each iteration, and walk up requests.

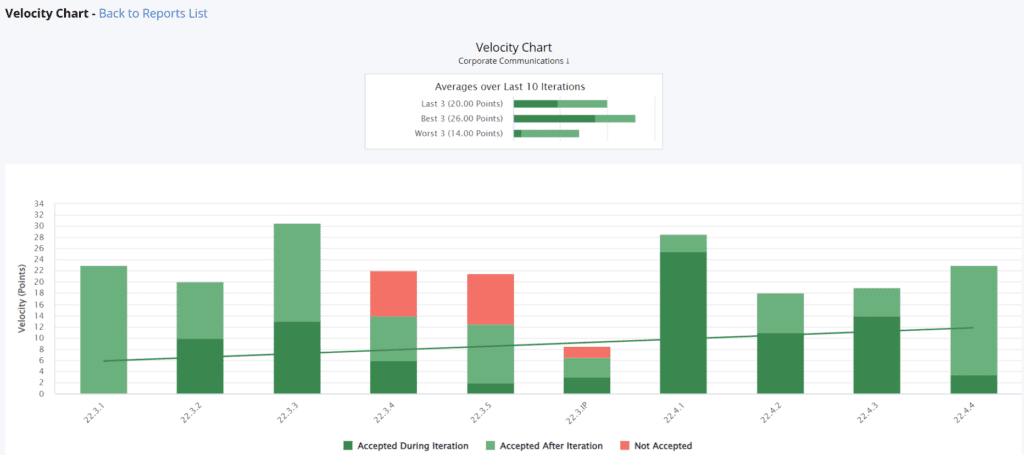
Velocity Chart and Cycle/Lead Time

As the Corporate Comms team grows, Amber wants to track the team’s flow better and share more data with the team during Iteration reviews. Specifically, she plans to use the velocity chart to see how the team’s velocity changes throughout each iteration:

Screenshot of a velocity chart on the Corporate Comms team
Velocity chart

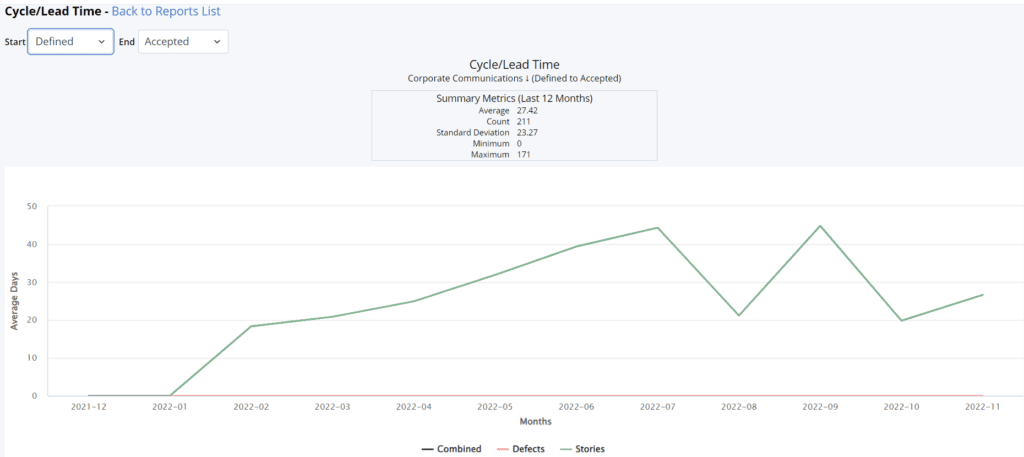
She also plans to use the cycle/lead time report to see how long it takes the team’s work to flow through the iterations.

Cycle/lead time report

Because dependencies impact the speed at which the team can do their work, Amber would like to start tracking how dependencies impact the team’s flow. Currently, the team uses daily standups and retrospectives to discuss work going through the kanban and when things don’t get finished in an iteration.

Competency

The Corporate Comms team recently completed a Team and Technical Agility assessment.

Amber is reviewing the organization-wide results with the LACE team and discussing how to analyze the results to determine next steps. But she has shared initial results with her team. Corporate Comms identified growths and strengths based on their results and retrospectives.

Growth area

They need to continue to work on their capacity/velocity to help their flow. 

Strength area

They are great at collaboration and peer review as a team. 

Team formation

Since their formation less than a year ago, the Corporate Comms team has learned a lot about how to work as a shared service for the whole company. They’ve created new outlets of communication and coordination to increase the value they can deliver.

About Amber Lillestolen

Amber is a Scrum Master at Scaled Agile. For years, she has used empathy and understanding to coach teams to reach their full potential. She enjoys working in a collaborative environment and is passionate about learning. Connect with Amber on LinkedIn.

About Madi Fisher

Madi is an Agile Coach at Scaled Agile. She has many years of experience coaching Agile teams in all phases of their journeys. She is a collaborative facilitator and trainer and leads with joy and humor to drive actionable outcomes. She is a true galvanizer! Connect with Madi on LinkedIn.

SAFe Metrics at the Team Level: Sales Ops

Contextualizing SAFe metrics: sales ops edition

SAFe® provides the strategic concepts and guidance that help steer transformations. And while the Framework metrics article focuses on high-level metrics like KPIs, OKRs, and strategic themes, some teams can struggle to contextualize SAFe metrics and measurement domains like flow, outcomes, and competency.

This is especially true for non-technical teams.

Even when metrics are captured, improvement areas might remain blurry without a shared understanding of what the metrics mean and show.

Diagram of metrics at the portfolio, Solution, ART, and team levels

How do teams with different skill sets, business objectives, and types of work all use the same measurement domains to gauge success? How do they know if they are on track to achieve PI Objectives and Iteration Goals?

We asked Scrum Masters from five different teams to answer five questions about the metrics they use to measure flow, outcomes, and competency. Their answers were illuminating, and we’re excited to share the results in a new article series titled “SAFe Metrics for Teams.” Each article will highlight one or more teams and take a close look at how they use SAFe metrics in their own domains.

TEAMS SURVEYED

  • Sales Ops
  • Communications
  • Multimedia
  • Customer Success
  • Product Development

METRICS SURVEY QUESTIONS

  • What metrics does your team use to track outcomes?
  • How do these metrics help your team define and plan work?
  • What flow metrics does your team use?
  • How has your team used metrics to drive continuous improvement?
  • How does your team self-assess competency?

Let’s get started!

Applying SAFe® Metrics for a Sales Operations Team

Sales ops teams are charged with enabling the sales team to hit their growth targets. This means sales ops should do work that creates a better, faster, and more predictable sales process, including:

  • Lead management and routing
  • Database integrity
  • Enablement training
  • Sales team onboarding
  • Continued learning and development
  • Contract management solutions
  • Sales process optimization
  • Much more  

By nature, sales ops work is often routine and process-heavy. It’s a lot of “run the business” or “business as usual” (BAU) work. Despite its sometimes repetitive nature, the pace and volume of this work will affect sales team objectives. Agile marketing teams are often in a similar position. 

Plus, enterprise-level sales are getting more complicated. There’s more technology, data, tools, and systems than ever. For sales leaders, this complexity means spending more time managing systems and less time working with teams and growing territories. As sales teams face increasing pressure to become more customer-centric and responsive, the demand for Agility also grows.

How can sales ops teams embrace the same Agile spirit and practice that drives other business areas like development and IT? More specifically, how can a sales ops department employ measurements like flow, outcomes, and competency in the same way as other SAFe teams?

For Kate Quigly, a senior Scrum Master with the sales ops team, it starts with the right mindset and clear goals focused on helping sales teams embrace Agility in their planning and operations. We asked Kate to lift the lid on her team’s process for using metrics, pursuing improvement, and applying SAFe measurement domains. Below, Kate explains how the sales ops team makes SAFe guidance work for them.

OUTCOMES

Question: What metrics does your team use to track outcomes? How do these metrics help your team define and plan work?

Answer: Outcomes are the perfect opportunity to assess which work is worth doing and what value is delivered. Here are the metrics we use to measure outcomes:

PI Objectives

The nature of our work makes it fairly simple to craft SMART PI objectives. Here’s an example of a good PI objective for a typical sales ops team:

  • Example: “To grow strategic accounts by five percent in Q1 2023, create three account plans per region, and complete five live training sessions with sales by the end of Q4 2022.”

This objective would align with our team’s mission to bolster the sales team’s performance and operations in several ways:

  1. It empowers sales to develop their account plans in the future. With this capability, sales can immediately take action to capture new opportunities in expanding regions.
  2. It’s written to help sales achieve growth targets, which could be a strategic theme and/or PI Objective for the entire ART.
  3. It enables future work that will contribute clear business value.

Team Business Value

Business value assignments are where we learn whether the right work was planned and completed correctly. We can use business value scores to understand the following:

  • Did we plan the right mix of work? For us, this could mean uncovering the wrong balance of BAU work vs. “user-facing” projects.
  • Were we able to complete our committed objectives? If not, why?
  • Were our objectives clear and measurable?
  • Are we delivering value?  

Iteration Goals

Iteration goals keep us focused on the most important work. Because iteration goals are not always reflected in a single story, we can check each iteration to see if visible work is actually contributing to our iteration goals (and PI Objectives). We want to discover if completed stories actually support the iteration goals. If there’s misalignment here, and we’re planning proper capacity, trouble could be around the corner.

Team Purpose Statement

While objective metrics are critical, qualitative assessments also matter. We often refer to our team purpose statement to check whether planned work needs to be rephrased, reexamined, or re-scoped to align with our core purpose.

FLOW

Question: What flow metrics does your team use?

Answer: Since we’re a relatively new team, we’re still honing the best set of metrics. I recommend using a variety of metrics as each one can highlight valuable insights. Right now, we use the following metrics most often:

Flow Velocity

  • Team velocity should be a stable, predictable measurement that helps the team forecast capacity for future work. Velocity metrics should never be compared across teams or used as a productivity measurement. Too much emphasis on achieving the right number can cause teams to “game” the system.  
  • I use some standard questions to spark conversations, including: 
    • Is our team velocity significantly dropping? Let’s discuss why.
    • Is our team velocity significantly increasing?  What’s the cause of this increase?
  • In particular, we look at the number of rollover stories from one iteration to the next. The root cause of these rollover stories can reveal issues with prioritization, role competency, and dependencies. This analysis helped our team discover a missing toolset needed for data management work.

Flow Time

We use cycle time scatterplot charts to show lead time and cycle time. These charts capture when an item starts and finishes. Low cycle time means the team is performing well and value flows fast to customers. Items with high cycle time are easy to identify and retrospect on.

Measuring flow time helped us find a recurring delay within the legal department. The delay caused an issue with generating new contracts, which are critical for our internal customers (sales) to finalize their work within a fixed timeline. 

This data helps us talk about problems in a new way by asking the following:

  1. Why did some items take so long to complete? What could we have done differently? Are there action items we can do to improve?
  2. Our average time to finish an item is X amount of days. What improvements would lower this for even more efficiency? 

Flow Distribution

Distribution is crucial for understanding whether we’re spending time on the right mix of work types. The team believes (rightly) that BAU work should be shown and recognized. Common BAU work includes:

  • Analyze closed lost/won deals
  • Data cleanup
  • Contract updates
  • Onboarding/offboarding tasks
  • Training, onboarding, and enablement 

However, I’ve had to coach the team on how to incorporate this type of work into Scrum, and how to balance BAU with “new development” work, which we affectionately call “special projects.” For our team, special projects would include work like:

  • Salesforce automations
  • New system implementation for key account management

For us, all of these metrics roll up into two primary dashboards. We frequently use the following charts to check our progress:

screenshot of an iteration cumulative flow diagram
Iteration cumulative flow diagram
screenshot of a release flow diagram
Release cumulative flow diagram
Burndown chart
  • Iteration and Release cumulative flow diagrams help visualize the work. These diagrams show cycle time, work in progress, and throughput.
  • This metric surfaced an interesting “stair step” pattern, which could indicate rushing at the end of the iteration. Once identified, we were able to find some key bottlenecks that are unique to the sales environment.
  • Burndown charts. These charts can predict the team’s likelihood of completing the committed work in a given time period. By visualizing the work in this way, you can see if delivery is on track, will complete early, or will be delayed.

Question: How has your team used metrics to drive continuous improvement?

Answer: These metrics help us identify mistakes, whether it’s a missed dependency, unclear acceptance criteria, or errant planning. For example, I’ve seen our team continually battle context switching, indicated by a large amount of work in progress (WIP). 

The context switching was causing us to miss more meaningful opportunities. For sales ops, this could mean putting new dashboards on hold and instead prioritizing new account research. During team retros, we can use questions like the following to identify improvement areas: 

  • Are there too many items “in progress” which can result in costly context switching?  
  • Are there too many items “in progress” which can signal a bottleneck problem in our workflow?
  • Is there a large amount of work that is “not started” that may cause us to delay or miss upcoming milestones?

Improvements tested:

  • Stop starting and start finishing by limiting WIP
  • Swarming or pairing to complete work faster 

Teams identify and embrace metrics depending on how you set the stage and approach these conversations. Again, for us, the priorities are clarified by focusing on the most valuable work instead of giving all planned work the same priority level. We must continually ask: “what’s the most value we can deliver this week, this iteration, and this PI?”

COMPETENCY

Question: How does your team self-assess competency?

Answer: As a new team, we’re focused on the team and technical agility assessment, which was just distributed to the team. I am very excited to use this as another tool to start team conversations about improvement areas.

Bonus Tips

Kate shared a few other key ways that sales ops teams can “think” Agile and adapt SAFe practices to their business domain:

  • Will the planned work allow sales team members to be more decentralized, productive, and empowered in their job?
  • Is the planned work only planned because “that’s the work we do”? 
  • What work would support cross-functional capabilities for sales teams/members?
    1. Example: A standardized sales deck with editable fields to eliminate dependence on graphic design support.
  • What processes can be automated to create economies of scale?
    1. Example: An automated, repeatable de-duplication process for faster and more accurate CRM data management.   

Overall, changing their way of thinking about work and measuring value has helped the sales ops team embrace Agile principles and improve alignment across the ART. As a result, they have better tools for visualizing, categorizing, and prioritizing BAU work with critical projects while also seeing the real value they deliver.

About Kate Quigly

Kate is a Senior Scrum Master at Scaled Agile, Inc. She has many years of experience coaching Agile teams with high energy and creativity.  She is passionate about lifelong learning, experimenting with teams, and creating a collaborative culture. Connect with Kate on LinkedIn.

About Madi Fisher

Madi is an Agile Coach at Scaled Agile. She has many years of experience coaching Agile teams in all phases of their journeys. She is a collaborative facilitator and trainer and leads with joy and humor to drive actionable outcomes. She is a true galvanizer! Connect with Madi on LinkedIn.