A Product Owner’s Answer to Who Writes User Stories in SAFe

Who writes user stories? 

Based on the Product Owner (PO) Framework article, POs manage and prioritize the team backlog. 

However, this doesn’t directly answer who writes user stories. Does managing and prioritizing include writing stories? Should POs write most or all of the stories? Or should the Agile Teams? 

This question arose when a new PO asked me for ideas for her team. She asked me, “Who writes the stories on your team?”  

Although I gave the new PO an answer about my team, how we worked, and shared who touches stories, this basic question stayed with me. 

Who should write the user stories? 

Here are three potential answers to consider:

  • Agile teams should write the user stories
  • POs should write the user stories
  • It depends on the situation

I’ll explain my reasoning and how I reached for SAFe® guidance considering each possible answer. I also hope you’ll check out the user story-writing resources at the end of this post.

How to determine who should write user stories

When Agile teams should write the user stories

Lean-Agile leaders have acknowledged a game-changing truth: attempting to ‘manage’ knowledge workers with traditional task management is counterproductive. Management visionary Peter Drucker was one of the first to point this out: “That [knowledge workers] know more about their job than anybody else in the organization is part of the definition of knowledge workers.

—SAFe Principle #8 article

To help answer the question of who writes user stories, I turned first to SAFe Principle #8, Unlock the intrinsic motivation of knowledge workers.

The importance of unlocking the intrinsic motivation of knowledge workers was never more apparent to me than when I became a PO. Many of my teammates had more experience with their expertise area and working on our courses than I did. 

This applies across many fields, products, and enterprises: your teammates become experts in what they are doing because most of us want to succeed at work. Thinking about how to help your team individually and collectively find motivation is key, and recognizing team members’ expertise is a crucial way to build trust and respect to lead the work effectively. 

The language in Principle #8 reminds me to define my role and sphere of influence. As a PO, I don’t manage people. However, for my team to produce great learning content, I must care about their knowledge, ideas, experiences, and expertise at each juncture of planning, refining, and iterating on the work they’re doing. 

On my team, Agile teammates usually write user stories. Every teammate has expertise that I don’t have. It would be foolish of me as a PO to write every story when someone else on my team understands the details about accomplishing the work more than I do. 

If I tried to represent their work by defining and writing every story, it could lead to too much rewriting. Rewriting a story is fine as we refine and understand more details and can often be done as a team activity alongside Backlog Refinement, estimation, and even Iteration Planning and it can be streamlined when the right expertise is applied as the story is discussed. 

If I wrote every story, I’d probably have to consult on and rewrite plenty (most) of them. Worse, it could demotivate my teammates if every story was dictated by their PO. 

That said, what I do as my team refines stories is:

1. Provide a strong voice in crafting acceptance criteria

2. Remind the team of our definition of done for work

3. Share who the customer is, and what they want

4. Work with the team (collectively and individually) on what counts as a “minimum viable story” for our backlog. 

You’ll find an example of a minimum viable story at the end of this post.

Why POs should manage, but not always write, user stories

While any team member can write stories at any time, it is the PO’s responsibility to ensure that they are well-formed and aligned with product strategy. The PO clarifies story details, applies user-story voice, ensures ‘INVEST’ characteristics are present, assists with story splitting, defines enablers, and incorporates behavior-driven design (BDD) to ensure stories support continuous value flow. The PO also allows space for ‘local’ stories and spikes that advance product design but are not derived explicitly from ART-level features.

—Product Owner article

My second answer to who writes user stories comes from the PO Framework article

POs “manage”  the team’s backlog and have content authority. This can mistakenly turn into an expectation that POs write the stories.

POs may write all the stories if:

1. Agile teams are not yet feeling the benefits of transformation. Therefore, they may be slow to embrace the work of writing stories themselves. It can become “another thing to do” or “taking time away from doing the actual work.” 

2. They want to ensure the ART and team backlogs are aligned, and stories in the team’s backlog meet the definition of done and support ART progress.

However, if the PO writes every story, they will have little time to perform all the functions POs are otherwise busy with!

For me, it’s important to note the Framework talks about management, not authorship. In fact, the PO article talks about guiding story creation rather than authoring stories.

We don’t find SAFe specifying that POs author the team backlog. What a PO does in order to manage the backlog and guide story creation is both different and deeper than simply writing everything in it:

  • Strategizing across the ART to meet ART-level objectives
  • Working with Product Managers, Business Owners, and the RTE to deeply understand the matrix of metrics the ART is using, strategic themes, and how both are applied 
  • Working closely with Product Managers, who own the ART Backlog, to refine features
  • Working closely with the team and stakeholders to decompose features into stories
  • Ensuring stories meet user needs and satisfy the team’s definition of done
  • Being the go-to person to share decisions the team is making on “how” to complete the work and how it may show up in meeting objectives
  • Prioritizing which work to do when so the team can accomplish its goals and contribute to the ART goals while maintaining flow

Here is the guidance I shared with another PO on the idea of the PO writing every story.

Becoming a story-writing PO will:

  • Create demonstrable work for the PO
  • Codify the (damaging) idea that writing stories is a bureaucratic task
  • Lead to future disagreements or dissatisfaction about what should be included in the scope of this work
  • Set POs up to be the target for those disagreements and dissatisfactions

Here’s what it won’t do. 

It won’t remove the need for teams to plan their work together to achieve flow or avoid rework or misunderstandings about what value is being delivered or how the team is delivering it.

For these reasons, I refuse to become a story-writing PO. I insist my team come together to discuss work and decide who is best informed to write a story. I further drive us to consider all of our stories in refinement so there are multiple teammate eyes on it. 

The immediate result of this process with some of my teammates early on was frustration: “I’m so busy that asking me to write about my work instead of doing it feels like you’re wasting my time.” 

Over time, it has borne other, much more nourishing fruit for the team, including: 

  • More paired work and team stories
  • Better flow and processes to manage flow
  • Growth of T-shaped skills
  • Improved understanding and thought about customer centricity across the team
  • An understanding of each other’s areas of expertise and how work connects on a cross-functional team

If you have teammates who resist writing stories, I recommend you surface this conflict sooner than later and work through it upfront.

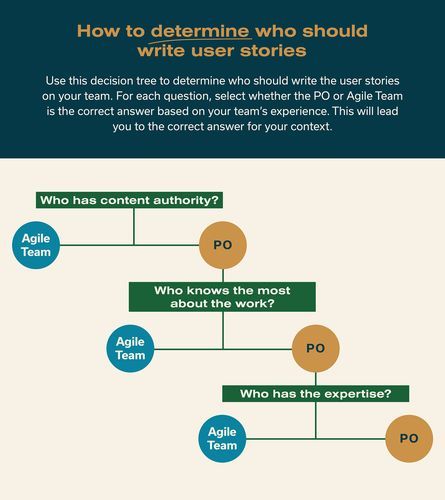
The most knowledgeable people write the user stories

I believe the best answer to who writes user stories is the answer to “Who knows the most about this work?” 

Sometimes the answer may be the PO because they’ve gathered the most information. 

In this case, it’s best for the PO to write the story. 

  1. I have been in an org-wide or ART-level meeting and know about work for every team. This has included tooling updates, requests to prepare specific demos of our work for different kinds of audiences, work around specific milestones, or professional development requests. 
  2. It is work that came out of my meetings with other teams to service dependencies. 
  3. It is walk-up work coming from changes or needs that weren’t surfaced before. 
  4. Talking with an internal or external customer helped me understand a need we had not previously written stories to meet.

It is rare I would write a story for work I am doing. In the above cases, the work would be handled by the team. By writing the story, I am capturing the need as I understand it but not carving the story in stone. 

When thinking of how stories enter the backlog, I find it useful to remember the three Cs of story writing

  • Card
  • Conversation
  • Confirmation

The C for conversation is most relevant to my mindset on this. The story is a promise our team will discuss this need and decide how to deliver value on it. 

The conversation could include: 

  • Refining our understanding of the user and their need
  • Revising acceptance criteria
  • Discussing who might start the work on it or how the team will deliver the work’s value 

This is the minimum viable story criteria my team uses.

Example of a minimum viable user story

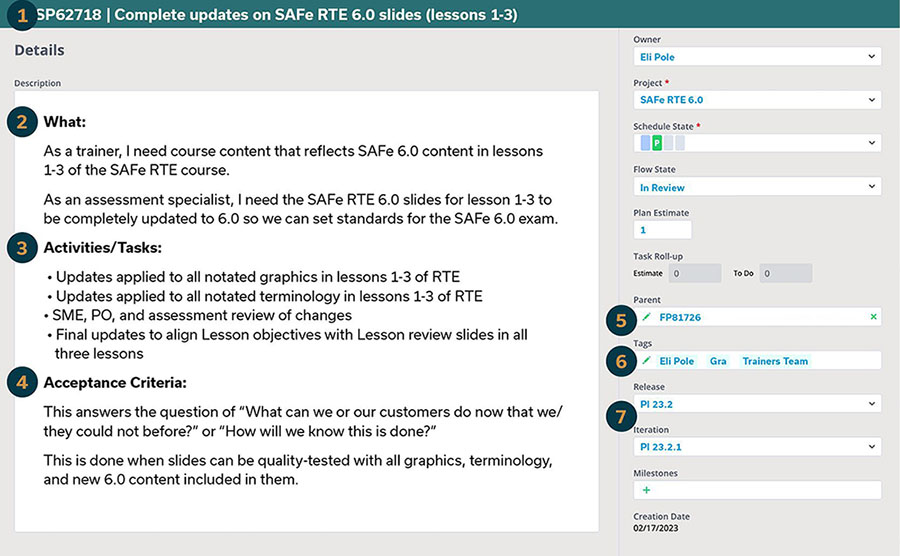
1. Story title: Provide a name that accurately describes the work
2. What: Give a description of the work
3. Activities or tasks: Break down what it will take to complete this work
4. Acceptance criteria: This answers the question, “What can we or our customers do now that we or they could not before?” or “How will we know this is done?”
5. Parent: Connect it to a feature where possible
6. Tags: We note if this is a team story (more than one person tagged) or an individual contributor’s work (a single person tagged)
7. PI and Iteration: When we expect to start and complete this work

I encourage you to use this template as a jumping-off point. 

Look through your backlog and think about who is and could write user stories with the most thoughtful details.

Story-writing resources

Now that I’ve shared my answer to who writes user stories, here are some resources to help write them.

If you want to receive helpful content like this for your role, don’t forget to set your role in SAFe Studio. This allows us to bring the best content to your SAFe Studio homepage. Set your role in SAFe Studio today.

Set your role in SAFe Studio
Log in now

About Christie Veitch

Blog author Christie Veitch headshot

As a writer and education nerd who loves processes, Christie seeks to move the needle on what learners can do and what educators and trainers will try with learners. She designs and delivers compelling content and training and builds communities of avid fans using these resources as a Scaled Agile, Inc. Product Owner. Connect with Christie on LinkedIn.

SAFe Metrics at the Team Level: Corporate Communications

Blog banner: Contextualizing SAFe metrics: corporate communications edition

We started this series on SAFe® team metrics with the simple acknowledgment that contextualizing SAFe metrics for a non-technical Agile team can be difficult. To continue learning how other teams adapt SAFe metrics to their specific context, I sat down with Amber Lillestolen, the Scrum Master of the Corporate Communications (Comms) team at Scaled Agile, Inc. Here’s what she shared about applying SAFe metrics for a ‘traditional’ communications team.

Applying SAFe® Metrics in Marketing for a Communications Team

Scaled Agile has a few small cross-functional marketing teams to support different business areas. Corporate Comms is one of these small teams. Their purpose is to propel market growth through a cohesive, compelling brand experience that inspires delight, confidence, and loyalty in current and prospective customers. 

The team works across the company—from public relations to customer stories and brand work for new product launches. Rather than debugging and deploying, communications professionals help simplify and communicate complex messaging, refine product value propositions, develop thought leadership content, and much more. This work requires significant cross-functional skill, research capabilities, collaboration, qualitative reasoning, and the ability to build alignment while planning for future releases. 

Their common work items include

  • Company-wide brand reviews
  • Auditing and updating brand guidelines
  • Market research
  • Developing product messaging and value propositions
  • Understanding customer needs and building messaging frameworks with other marketing teams
  • Thought leadership content development with executives
  • Public relations strategy and management
  • Material preparation for events and conferences 
  • Recruiting and curating event customer stories
  • Naming and messaging standardization across the organization 

Amber is Corporate Comms’ first Scrum Master, about four months into serving the team. Corporate Comms is a unique team because they are a shared service across the organization. This means they receive a significant amount of walk-up work from other teams. Since this type of work consistently (though not always predictably) consumes a portion of the team’s capacity, it’s important to track it using metrics. 

Below, Amber shares her process for tracking the team’s performance, including which metrics she uses to coach and guide the team. We separated these team metrics into the three measurement domains outlined in the metrics article: outcomes, flow, and competency.

Outcomes

Question: What metrics do you use to measure outcomes?

Outcome metric #1: PI Objectives

The Corporate Comms team reviews PI objectives throughout the PI to ensure that their related features are progressing. This helps the team determine if they are ahead, on track, or behind on the outcomes they promised to deliver in the PI.

Here’s a basic example of a Corporate Comms PI objective:  

In support of SAFe’s evolving brand, provide enablement resources for applying new communication messaging and naming to team-level assets.

Outcome metric #2: Iteration Goals

The team creates goals every iteration and tracks their progress. They create goals related to the high-priority stories planned for the iteration.

Flow

Question: What metrics do you use to measure flow?

PI objectives

For Amber, flow is about delivering value, so she also included PI objectives under the flow metrics category. The Corporate Comms team uses PI objectives to measure its flow as part of the Operations Agile Release Train (ART). She reviews the team’s objectives during iterations to help the team understand what value they’re bringing to the organization.

If you don’t remember seeing PI objectives in the flow section of the SAFe Metrics article, you’re right. flow metrics, like predictability, show how well teams achieve outcomes like a PI Objective. 

But for the Corporate Comms team, tracking the degree to which an objective is completed functions as a handy ‘pseudo-flow’ metric for the comms team. Ultimately, their PI objectives will roll up into broader Program Predictability Measurements, but this is a good way to track flow predictability on a smaller scale at the team level. 

This is a good example of adapting metrics to meet their team needs, and simplifying their measurement process to retain its simplicity and usability. If objectives are continually missed over several PIs, this means value isn’t flowing. And value flow is the purpose of flow metrics.

Amber combines PI Objective progress with a review of the team’s velocity to understand the flow of value and completed work each iteration.

Flow Distribution and Flow Velocity

Flow distribution measures the amount of work type in a system over time, which is important for the Corporate Comms team to track.

As mentioned above, Corporate Comms is a shared services team. This means the entire organization is an internal customer of their work. As a result, the team has frequent walk-up work from other groups. Some examples of the team’s walk-up work include:

  • Booth designs for domestic and international events
  • Market research and analysis when a change occurs
  • Reviewing other teams’ slide decks and presentation materials

Because this walk-up work is a regular occurrence for the team, they reserve some of their capacity for it each iteration. It’s important for the team to see how their work is distributed across planned and unplanned work so they know how much capacity on average to reserve for walk-up work each iteration. 
They track their capacity in an ALM tool using the following views:

screenshot of Iteration Summary view in Rally
Iteration Summary view in ALM tool
Screenshot: Team planning view in Rally
Team Planning view in ALM tool
Team planning view in ALM tool (work items blurred for confidentiality)

The team looks at their capacity and velocity metrics during iteration planning to see if they are over capacity. 

Flow velocity measures the number of backlog items completed over a period of time; in Corporate Comms’ case, this period of time is an iteration. 

They review these metrics at iteration review to see if they finished all planned work. Amber also uses the team planning board in an ALM tool to show if the team is over capacity and discuss what items need to move at iteration planning to adjust their capacity.

Using capacity metrics to move stories

If the team discovers they’re over capacity, it’s usually for one of two reasons: 

1) Long review cycles

2) Undefined work

A lot of the team’s work is tied to cross-functional changes across the business, and those carry unknowns. As strategy evolves, sometimes the work changes to match what’s new.

Marketing teams are prone to getting buried in last minute requests and repeated context switching. SAFe provides a shared language and approach to work that teams can use to define:

  • What work can be done
  • How long that work will take
  • Dependencies
  • What other work needs to move or change to accommodate priority requests

This is a helpful level-set on expectations for how other teams can protect the time and resources needed to deliver planned value.

Reserving capacity for walk-up work

Amber also tracks the work that comes in and the team adds stories for walk-up work. They use this data to measure unplanned work requests during the PI compared to the work planned during PI Planning. 

During the last PI, which was the team’s first PI Planning with a Scrum Master, Amber encouraged the team to plan to only 80 percent capacity to allow for any walk-up work. She arrived at this number based on the 20 percent of walk-up work from previous capacity and velocity metrics. 

The team also uses ‘bucket’ user stories every iteration for team members who run office hours and complete other routine work. Office hours are blocks of time reserved for people from other teams in the organization to bring items to Corporate Comms for review. These brand office hours occur three times a week for an hour. 

Any work brought to office hours that will take over two hours becomes a story with points and is added to the iteration based on urgency and capacity. Tracking their work this way creates a reliable record of capacity needed to address business as usual items, planned new work each iteration, and walk up requests.

Velocity Chart and Cycle/Lead Time

As the Corporate Comms team grows, Amber wants to track the team’s flow better and share more data with the team during Iteration reviews. Specifically, she plans to use the velocity chart to see how the team’s velocity changes throughout each iteration:

Screenshot of a velocity chart on the Corporate Comms team
Velocity chart

She also plans to use the cycle/lead time report to see how long it takes the team’s work to flow through the iterations.

Cycle/lead time report

Because dependencies impact the speed at which the team can do their work, Amber would like to start tracking how dependencies impact the team’s flow. Currently, the team uses daily standups and retrospectives to discuss work going through the kanban and when things don’t get finished in an iteration.

Competency

The Corporate Comms team recently completed a Team and Technical Agility assessment.

Amber is reviewing the organization-wide results with the LACE team and discussing how to analyze the results to determine next steps. But she has shared initial results with her team. Corporate Comms identified growths and strengths based on their results and retrospectives.

Growth area

They need to continue to work on their capacity/velocity to help their flow. 

Strength area

They are great at collaboration and peer review as a team. 

Team formation

Since their formation less than a year ago, the Corporate Comms team has learned a lot about how to work as a shared service for the whole company. They’ve created new outlets of communication and coordination to increase the value they can deliver.

About Amber Lillestolen

Amber is a Scrum Master at Scaled Agile. For years, she has used empathy and understanding to coach teams to reach their full potential. She enjoys working in a collaborative environment and is passionate about learning. Connect with Amber on LinkedIn.

About Madi Fisher

Madi is an Agile Coach at Scaled Agile. She has many years of experience coaching Agile teams in all phases of their journeys. She is a collaborative facilitator and trainer and leads with joy and humor to drive actionable outcomes. She is a true galvanizer! Connect with Madi on LinkedIn.

SAFe Metrics at the Team Level: Sales Ops

Contextualizing SAFe metrics: sales ops edition

SAFe® provides the strategic concepts and guidance that help steer transformations. And while the Framework metrics article focuses on high-level metrics like KPIs, OKRs, and strategic themes, some teams can struggle to contextualize SAFe metrics and measurement domains like flow, outcomes, and competency.

This is especially true for non-technical teams.

Even when metrics are captured, improvement areas might remain blurry without a shared understanding of what the metrics mean and show.

Diagram of metrics at the portfolio, Solution, ART, and team levels

How do teams with different skill sets, business objectives, and types of work all use the same measurement domains to gauge success? How do they know if they are on track to achieve PI Objectives and Iteration Goals?

We asked Scrum Masters from five different teams to answer five questions about the metrics they use to measure flow, outcomes, and competency. Their answers were illuminating, and we’re excited to share the results in a new article series titled “SAFe Metrics for Teams.” Each article will highlight one or more teams and take a close look at how they use SAFe metrics in their own domains.

TEAMS SURVEYED

  • Sales Ops
  • Communications
  • Multimedia
  • Customer Success
  • Product Development

METRICS SURVEY QUESTIONS

  • What metrics does your team use to track outcomes?
  • How do these metrics help your team define and plan work?
  • What flow metrics does your team use?
  • How has your team used metrics to drive continuous improvement?
  • How does your team self-assess competency?

Let’s get started!

Applying SAFe® Metrics for a Sales Operations Team

Sales ops teams are charged with enabling the sales team to hit their growth targets. This means sales ops should do work that creates a better, faster, and more predictable sales process, including:

  • Lead management and routing
  • Database integrity
  • Enablement training
  • Sales team onboarding
  • Continued learning and development
  • Contract management solutions
  • Sales process optimization
  • Much more  

By nature, sales ops work is often routine and process-heavy. It’s a lot of “run the business” or “business as usual” (BAU) work. Despite its sometimes repetitive nature, the pace and volume of this work will affect sales team objectives. Agile marketing teams are often in a similar position. 

Plus, enterprise-level sales are getting more complicated. There’s more technology, data, tools, and systems than ever. For sales leaders, this complexity means spending more time managing systems and less time working with teams and growing territories. As sales teams face increasing pressure to become more customer-centric and responsive, the demand for Agility also grows.

How can sales ops teams embrace the same Agile spirit and practice that drives other business areas like development and IT? More specifically, how can a sales ops department employ measurements like flow, outcomes, and competency in the same way as other SAFe teams?

For Kate Quigly, a senior Scrum Master with the sales ops team, it starts with the right mindset and clear goals focused on helping sales teams embrace Agility in their planning and operations. We asked Kate to lift the lid on her team’s process for using metrics, pursuing improvement, and applying SAFe measurement domains. Below, Kate explains how the sales ops team makes SAFe guidance work for them.

OUTCOMES

Question: What metrics does your team use to track outcomes? How do these metrics help your team define and plan work?

Answer: Outcomes are the perfect opportunity to assess which work is worth doing and what value is delivered. Here are the metrics we use to measure outcomes:

PI Objectives

The nature of our work makes it fairly simple to craft SMART PI objectives. Here’s an example of a good PI objective for a typical sales ops team:

  • Example: “To grow strategic accounts by five percent in Q1 2023, create three account plans per region, and complete five live training sessions with sales by the end of Q4 2022.”

This objective would align with our team’s mission to bolster the sales team’s performance and operations in several ways:

  1. It empowers sales to develop their account plans in the future. With this capability, sales can immediately take action to capture new opportunities in expanding regions.
  2. It’s written to help sales achieve growth targets, which could be a strategic theme and/or PI Objective for the entire ART.
  3. It enables future work that will contribute clear business value.

Team Business Value

Business value assignments are where we learn whether the right work was planned and completed correctly. We can use business value scores to understand the following:

  • Did we plan the right mix of work? For us, this could mean uncovering the wrong balance of BAU work vs. “user-facing” projects.
  • Were we able to complete our committed objectives? If not, why?
  • Were our objectives clear and measurable?
  • Are we delivering value?  

Iteration Goals

Iteration goals keep us focused on the most important work. Because iteration goals are not always reflected in a single story, we can check each iteration to see if visible work is actually contributing to our iteration goals (and PI Objectives). We want to discover if completed stories actually support the iteration goals. If there’s misalignment here, and we’re planning proper capacity, trouble could be around the corner.

Team Purpose Statement

While objective metrics are critical, qualitative assessments also matter. We often refer to our team purpose statement to check whether planned work needs to be rephrased, reexamined, or re-scoped to align with our core purpose.

FLOW

Question: What flow metrics does your team use?

Answer: Since we’re a relatively new team, we’re still honing the best set of metrics. I recommend using a variety of metrics as each one can highlight valuable insights. Right now, we use the following metrics most often:

Flow Velocity

  • Team velocity should be a stable, predictable measurement that helps the team forecast capacity for future work. Velocity metrics should never be compared across teams or used as a productivity measurement. Too much emphasis on achieving the right number can cause teams to “game” the system.  
  • I use some standard questions to spark conversations, including:
    • Is our team velocity significantly dropping? Let’s discuss why.
    • Is our team velocity significantly increasing?  What’s the cause of this increase?
  • In particular, we look at the number of rollover stories from one iteration to the next. The root cause of these rollover stories can reveal issues with prioritization, role competency, and dependencies. This analysis helped our team discover a missing toolset needed for data management work.

Flow Time

We use cycle time scatterplot charts to show lead time and cycle time. These charts capture when an item starts and finishes. Low cycle time means the team is performing well and value flows fast to customers. Items with high cycle time are easy to identify and retrospect on.

Measuring flow time helped us find a recurring delay within the legal department. The delay caused an issue with generating new contracts, which are critical for our internal customers (sales) to finalize their work within a fixed timeline. 

This data helps us talk about problems in a new way by asking the following:

  1. Why did some items take so long to complete? What could we have done differently? Are there action items we can do to improve?
  2. Our average time to finish an item is X amount of days. What improvements would lower this for even more efficiency? 

Flow Distribution

Distribution is crucial for understanding whether we’re spending time on the right mix of work types. The team believes (rightly) that BAU work should be shown and recognized. Common BAU work includes:

  • Analyze closed lost/won deals
  • Data cleanup
  • Contract updates
  • Onboarding/offboarding tasks
  • Training, onboarding, and enablement 

However, I’ve had to coach the team on how to incorporate this type of work into Scrum, and how to balance BAU with “new development” work, which we affectionately call “special projects.” For our team, special projects would include work like:

  • Salesforce automations
  • New system implementation for key account management

For us, all of these metrics roll up into two primary dashboards. We frequently use the following charts to check our progress:

screenshot of an iteration cumulative flow diagram
Iteration cumulative flow diagram
screenshot of a release flow diagram
Release cumulative flow diagram
A screenshot of a burndown chart
Burndown chart
  • Iteration and Release cumulative flow diagrams help visualize the work. These diagrams show cycle time, work in progress, and throughput.
  • This metric surfaced an interesting “stair step” pattern, which could indicate rushing at the end of the iteration. Once identified, we were able to find some key bottlenecks that are unique to the sales environment.
  • Burndown charts. These charts can predict the team’s likelihood of completing the committed work in a given time period. By visualizing the work in this way, you can see if delivery is on track, will complete early, or will be delayed.

Question: How has your team used metrics to drive continuous improvement?

Answer: These metrics help us identify mistakes, whether it’s a missed dependency, unclear acceptance criteria, or errant planning. For example, I’ve seen our team continually battle context switching, indicated by a large amount of work in progress (WIP). 

The context switching was causing us to miss more meaningful opportunities. For sales ops, this could mean putting new dashboards on hold and instead prioritizing new account research. During team retros, we can use questions like the following to identify improvement areas: 

  • Are there too many items “in progress” which can result in costly context switching?  
  • Are there too many items “in progress” which can signal a bottleneck problem in our workflow?
  • Is there a large amount of work that is “not started” that may cause us to delay or miss upcoming milestones?

Improvements tested:

  • Stop starting and start finishing by limiting WIP
  • Swarming or pairing to complete work faster 

Teams identify and embrace metrics depending on how you set the stage and approach these conversations. Again, for us, the priorities are clarified by focusing on the most valuable work instead of giving all planned work the same priority level. We must continually ask: “what’s the most value we can deliver this week, this iteration, and this PI?”

COMPETENCY

Question: How does your team self-assess competency?

Answer: As a new team, we’re focused on the team and technical agility assessment, which was just distributed to the team. I am very excited to use this as another tool to start team conversations about improvement areas.

Bonus Tips

Kate shared a few other key ways that sales ops teams can “think” Agile and adapt SAFe practices to their business domain:

  • Will the planned work allow sales team members to be more decentralized, productive, and empowered in their job?
  • Is the planned work only planned because “that’s the work we do”? 
  • What work would support cross-functional capabilities for sales teams/members?
    1. Example: A standardized sales deck with editable fields to eliminate dependence on graphic design support.
  • What processes can be automated to create economies of scale?
    1. Example: An automated, repeatable de-duplication process for faster and more accurate CRM data management.   

Overall, changing their way of thinking about work and measuring value has helped the sales ops team embrace Agile principles and improve alignment across the ART. As a result, they have better tools for visualizing, categorizing, and prioritizing BAU work with critical projects while also seeing the real value they deliver.

About Kate Quigly

Blog author Kate Quigly headshot

Kate is a Senior Scrum Master at Scaled Agile, Inc. She has many years of experience coaching Agile teams with high energy and creativity.  She is passionate about lifelong learning, experimenting with teams, and creating a collaborative culture. Connect with Kate on LinkedIn.

About Madi Fisher

Blog author Madi Fisher headshot

Madi is an Agile Coach at Scaled Agile. She has many years of experience coaching Agile teams in all phases of their journeys. She is a collaborative facilitator and trainer and leads with joy and humor to drive actionable outcomes. She is a true galvanizer! Connect with Madi on LinkedIn.

Connecting OKRs, KPIs, OVSs, and DVSs – For Successful SAFe® Implementation

The title of my post may read like acronym soup but all of these concepts play a critical role in SAFe, and understanding how they’re connected is important for successful SAFe implementation. After exploring some connections, I will suggest some actions you can take while designing, evaluating, or accelerating your implementation.

KPIs and OKRs

The SAFe Value Stream KPIs article describes Key Performance Indicators (KPIs) as “the quantifiable measures used to evaluate how a value stream is performing against its forecasted business outcomes.

That includes:

  • Health of day-to-day performance
  • Work to create sustainable change in performance

Objectives and Key Results (OKRs) are meant to be about driving and evaluating change rather than maintaining the status quo. Therefore, they are a special kind of KPI. Objectives point towards the desired state. Key results measure progress towards that desired state. 

But how do these different concepts map to SAFe’s Operational Value Streams (OVSs) and Development Value Streams (DVSs)? And why should you care?

Changing and Improving the Operation

Like Strategic Themes, most OKRs point to the desired change in business performance. These OKRs would be the ones that company leadership cares about. And they would be advanced through the efforts of a DVS (or multiple ones). 

For example, if the business wants to move to a subscription/SaaS model, that’s a change in the operating model—a change in how the OVS looks and operates. That change is supported by the development of new systems and capabilities, which is work that will be accomplished by a DVS (or multiple ones). 

This view enables us to recognize the wider application of the DVS concept that we talk about in SAFe 5. Business agility means using Agile and SAFe constructs to develop any sort of changing the business needs, regardless of whether that change includes IT or technology.

Whenever we are trying to change our operation, there’s a question about how much variability we’re expecting around this change. Is there more known than the unknown? Or vice versa? Are we making this change in an environment of volatility, uncertainty, complexity, and ambiguity? If yes, then using a DVS construct that employs empiricism to seek the right answers to how to achieve the OKR is essential, regardless of how much IT or technology is involved. We might have an OKR that requires business change involving mainly legal, marketing, procurement, HR, and so on, that would still benefit from an Agile and SAFe DVS approach.

These OKRs would then find themselves elaborated and advanced through the backlogs and backlog items in the various ARTs and teams involved in this OKR. 

In some cases, an OKR would drive the creation of a focused DVS. This is the culmination of the Organize around Value Lean-Agile SAFe Principle. This is why Strategic Themes and OKRs should be an important consideration when trying to identify value streams and ARTs (in the Value Stream and ART identification workshop). And a significant new theme/OKR should trigger some rethinking of whether the current DVS network is optimally organized to support the new value creation goals set by the organization.

Maintaining the Health of the Operation

As mentioned earlier, maintaining the health of the operation is also tracked through KPIs. Here we expect stability and predictability in performance. It’s crucial work but it’s not what OKRs or Strategic Themes are about. 

This work can be simple, complex, or even chaotic depending on the domain. The desire of any organization is to bring its operation under as much control as possible and minimize variability as it makes sense in the business domain. What this means is that in many cases, we don’t need Agile and empiricism in order to actually run the operation. Lean and flow techniques can still be useful to create sustainable, healthy flow (see more in the Organizational Agility competency). 

Whenever people working in the OVS switch to improving the OVS (or in other words working on versus in the operation), they are, in essence, moving over implicitly to a DVS. 

Some organizations make this duality explicit by creating a DVS that involves a combination of people who spend some of their time in the OVS and some of their time working on it together with people who are focused on working on the OVS. For example, an orthopedic clinic network in New England created a DVS comprising clinicians, doctors, PAs, and billing managers (that work the majority of their time in the OVS) together with IT professionals. Major improvements to the OVS happen in this DVS.

Improving the Development Value Stream

The DVS needs to relentlessly improve and learn as well. Examples of OKRs in this space could be: improving time-to-market, as measured by improved flow time or by improving the predictability of business value delivered, as measured by improved flow predictability. It could also be: organize around value, measured by the number of dependencies and the reduction in the number of Solution Trains required. 

This is also where the SAFe transformation or Agile journey lives. There are ways to improve DVSs or the overall network of DVSs, creating a much-improved business capability to enhance its operation and advance business OKRs. 

Implementing OKRs in this space relates more to enablers in the SAFe backlogs than to features or capabilities. Again, these OKRs change the way the DVS works.

Running the Development Value Stream

Similar metrics can be used as KPIs that help maintain the health of the DVS on an ongoing basis. For example, if technical debt is currently under control, a KPI monitoring it might suffice and hopefully will help avoid a major technical debt crisis. If we weren’t diligent enough to avoid the crisis, an objective could be put in place to significantly reduce the amount of technical debt. Achieving a certain threshold for a tech debt KPI could serve as a key result (KR) for this objective. Once it’s achieved, we might leave the tech debt KPI in place to maintain health. 

It’s like continuing to monitor your weight after you’ve gone on a serious diet. During the diet, you have an objective of achieving a healthy weight with a KR tracking BMI and aiming to get below 25. After achieving your objective, you continue to track your BMI as a KPI.

Taking Action to Advance Your Implementation Using OKRs

In this blog post, we explored the relationship between operational and development value streams and the Strategic Themes and OKRs. We’ve seen OVS KPIs and OKRs as well as DVS OKRs and KPIs. 

A key step in accelerating business agility is to continually assess whether you’re optimally organized around value. OKRs can provide a very useful lens to use for this assessment. 

Start by reviewing your OKRs and KPIs and categorize them according to OVS/DVS/Change/Run.

You can use the matrix below.

Run-focused OKRs

If you find some OKRs on the left side of the matrix, it’s time to rethink. 

Run-focused OKRs should actually be described as KPIs. Discuss the difference and whether you’re actually looking for meaningful change to these KPIs (in which case it really can be an OKR—but make sure it is well described as one) or are happy to just maintain a healthy status quo. 

You can then consider your DVS network/ART/team topology. Is it sufficiently aligned with your OKRs/KPIs? Are there interesting opportunities to reorganize around value?

This process can also be used in a Value Stream Identification workshop for the initial design of the implementation or whenever you want to inspect and adapt it.

Find me on LinkedIn to learn more about making these connections in your SAFe context via an OKR workshop.

About Yuval Yeret

Yuval is a SAFe Fellow and the head of AgileSparks

Yuval is a SAFe Fellow and the head of AgileSparks (a Scaled Agile Partner) in the United States where he leads enterprise-level Agile implementations. He’s also the steward of The AgileSparks Way and the firm’s SAFe, Flow/Kanban, and Agile Marketing. Find Yuval on LinkedIn.

Share:

Back to: All Blog Posts

Next: Aligning Global Teams Through Agile Program Management: A Case Study

How to Measure Team Performance: A Scrum Master Q+A

Assessing your team’s agility is an important step on the path to continuous improvement. After all, you can’t get where you want to go if you don’t know where you are. But you probably have questions: How do you measure a team’s agility, anyway? Who should do it, and when? What happens with the data you collect, and what should you do afterwards?

To bring you the answers, we interviewed two of our experienced scrum masters, Lieschen Gargano and Sam Ervin. Keep reading to learn their recommendations for running a Team successfully and Technical Agility Assessment.

Q: How does SAFe help teams measure their agility, and why should I care? 

Measure and Grow is the Scaled Agile Framework’s approach to evaluating agility and determining what actions to take next. Measure and Grow assessment tools and recommendation actions help organizations and teams reflect on where they are and know how to improve. 

The SAFe® Business Agility Assessment measures an organization’s overall agility across seven core competencies: team and technical agility, agile product delivery, enterprise solution delivery, Lean portfolio management, Lean-agile leadership, organizational agility, and continuous learning culture. 

business agility assessment

The SAFe Core Competency Assessments measure each of these core competencies on a deeper level. For example, the Team and Technical Agility (TTA) Core Competency Assessment helps teams identify areas for improvement, highlight strengths worth celebrating, and baseline performance against future growth. It asks questions about how your team operates. Do team members have cross-functional skills? Do you have a dedicated PO? How are teams of teams organized in your agile release trains (ARTs)? Do you use technical practices like test-driven development and peer review? How does your team tackle technical debt?

For facilitators, including scrum masters, the Team and Technical Agility Assessment is a great way to create space for team reflection beyond a typical retrospective. It can also increase engagement and buy-in for the team to take on actionable improvement items.

Q: Who should run a Team and Technical Agility Assessment? 

Running assessments can be tricky. Teams might feel defensive about being “measured.” Self-reported data isn’t always objective or accurate. Emotions and framing can impact the results. That’s why SAFe recommends that a scrum master or other trained facilitator run the assessment. A scrum master, SPC, or agile coach can help ensure that teams understand their performance and know where to focus their improvement efforts. 

Q: When should I do this assessment?

It’s never too early or too late to know where you stand. Running the assessment for your team when you’re first getting started with an agile transformation will help you target the areas where you most need to improve, but you can assess team performance at any time. 

As for how frequently you should run it … it’s probably more valuable to do it on a cadence—either once a PI or once a year, depending on the team’s goals and appetite for it. There’s a lot of energy in seeing how you grow and progress as a team, and it’s easier to celebrate wins that are demonstrated through documented change over time than through general sentiment.

Q: Okay, how do I prepare for and run it?

The agility assessment tools are available free to SAFe members and customers at the Measure and Grow page on the SAFe Community Platform. There you can choose from tools created for us by our partners, AgilityHealth and Comparative Agility.

Before you start the Team and Technical Agility Assessment, define your team’s shared purpose. This will help you generate buy-in and excitement. If the team feels like they’re just doing the assessment because the scrum master said so, it won’t be successful. They have to see value in it for them, both as individuals and as a team. 

Some questions we like to ask to set this purpose include, “What do we want it to feel like to be part of this team, two PIs from now?” And, “How will our work lives be improved when we check in one year from now?”

There are two ways you can approach running this assessment. Option #1 is to have team members take the assessment individually, and then get together to discuss their results as a group. Option #2 is to discuss the assessment questions together and come to a consensus on the group’s answers.

When we’ve run this assessment we’ve had team members do it individually, so we could focus our time together on review and actions. If you do decide to run it asynchronously it’s important as a facilitator to be available to team members, in case they have questions before you review your answers as a team.

Q: What else should I keep in mind?

We like to kick off the assessment with a meeting invitation that includes a draft agenda. Sending this ahead of time gives everyone a chance to prepare. You can keep the agenda loose so you have flexibility to spend more or less time discussing particular areas, depending on how your team chooses to engage with each question.

Q: Is the assessment anonymous? 

Keeping the answers anonymous is really helpful if you want to get more accurate results. We like to be very clear upfront that the assessment will be anonymous, so that team members can feel confident about being honest in their answers. 

For example, with our teams, we not only explained the confidentiality of individuals’ answers but demonstrated in real-time how the tool itself works so that the process would feel open and transparent. We also made it clear that we would not be using the data to compare teams to each other, or for any purpose other than to gain a shared understanding of where we are selecting improvement items based on the team’s stated goals.

Q: Then what? What do I do with the results?

Once you’ve completed the assessment using one of the two approaches, you’ll want to review the sections one by one, showing the aggregate results and allowing the team to notice their top strengths and top areas for improvement. Your job as facilitator is NOT to tell them what you think based on the results; it’s to help guide the team’s own discussion as they explore the answers. This yields much more effective outcomes!

One thing one of us learned in doing the assessment was how much we disagreed on some things. For example, even with a statement as simple as, “Teams execute standard iteration events,” some team members scored us a five (out of five) while others scored us a one. We treated every score as valid and sought to understand why some team members scored high and others low, just like we do when estimating the size of a user story. During this conversation, we learned an important fact. The product owner thought the iteration was executed in a standard way because she was the one executing it. But team members gave that statement a low score because they weren’t included in much of the decision-making. There was no consensus understanding for what “standard iteration events” meant to the team. 

This prompted a conversation about why the team isn’t always included in how the iteration was executed. We talked about the challenge of aligning schedules to share responsibility for decision-making in meetings. And we talked about the impact of team members not having the opportunity to contribute. 

As a result, the assessment did more than help us see where we needed to improve; it showed us where we had completely different perspectives about how we were doing. It prompted rich conversations that led to meaningful progress.

Q: Okay, I ran the assessment; now what? What are the next steps?

With your assessment results in hand, it’s now time to take actions that help you improve. For each dimension of the Team and Technical Agility Assessment, SAFe provides growth recommendations to help teams focus on the areas that matter most and prioritize their next steps. You should: 

  • Review the team growth recommendations together to generate ideas
  • Select your preferred actions (you can use dot voting or WSJF calculations for this; SAFe® Collaborate has ready-made templates you can use)
  • Capture your team’s next steps in writing: “Our team decided to do X, Y, and Z.” 
  • Follow through on your actions, so that you’re connecting them to the desired outcome
  • Check in on your progress at the beginning of iteration retrospectives

Finally, you’ll want to use these actions to set a focus for the team throughout the PI, and check in with business owners at PI planning on how these improvements have helped the organization make progress toward its goals.

Q: I’m ready! How do I get started? 

Fantastic. Just visit the Measure and Grow page at the SAFe Community Platform to choose your assessment tool. While you’re there, you can watch the video for tips or download the Measure and Grow Toolkit for play-by-play guidance. As you’re running the assessment, use the SAFe Collaborate templates to guide the discussion and identify actions and next steps. 

Have fun!

About the authors

Lieschen is a product owner and former scrum master at Scaled Agile.

Lieschen is a product owner and former scrum master at Scaled Agile. She’s also an agile coach and conflict guru—thanks in part to her master’s degree in conflict resolution. Lieschen loves cultivating new ideas and approaches to agile to keep things fresh and exciting. And she’s passionate about developing best practices for happy teams to deliver value in both development and non-technical environments. Fun fact? “I’m the only person I know of who’s been a scrum master and a scrum-half on a rugby team.”

Blog author Sam Ervin headshot

Sam is a certified SAFe® 5.0 Program Consultant (SPC) and serves as the scrum master for several teams at Scaled Agile. His recent career highlights include entertaining the crowd as the co-host of the 2019 and 2020 Global SAFe® Summits. A native of Columbia, South Carolina, Sam lives in Denver, CO, where he enjoys CrossFit and Olympic weightlifting.

Share:

Back to: All Blog Posts

Next: The Unparalleled Value of Emotional Intelligence, Part Two

How 90 Teams Used Measure and Grow to Improve Performance by 134 Percent

This post is part of an ongoing blog series where Scaled Agile Partners share stories from the field about using Measure and Grow assessments with customers to evaluate progress and identify improvement opportunities.

One of our large financial services clients needed immediate help. It was struggling to meet customer demands and industry regulations and needed to align business priorities to capacity before it was outplayed by competitors. The company thought the answer would be to invest in business in Agility practices. But so far, that strategy didn’t seem to be paying off. 

Teams were in constant flux and the ongoing change was causing unstable, unpredictable performance. The leading question was, “How can we get more output from existing capacity?”

Among the client’s key challenges:

  • No visibility into common patterns across teams
  • Inspect-and-adapt data was stuck in PowerPoint and Excel
  • Output expectations didn’t match current capacity
  • Teams weren’t delivering outcomes aligned to business value

Getting a baseline on team health 

We introduced the AgilityHealth® TeamHealth Radar Assessment to the continuous improvement leadership team, and it decided to pilot the assessment across the portfolio. Within a few weeks after launching the assessment, the organization got a comprehensive readout. It identified the top areas of improvement and key roadblocks for 90+ teams. 

These baseline results showed a lack of a backlog, not to mention a lack of clarity around the near-term roadmap. Teams were committing to work that wasn’t attached to any initiatives and the work wasn’t well-defined. Dependencies and impediments weren’t being managed. And the top areas of improvement matched data collected during inspect and adapt exercises over the previous two years. Even though the organization had previously identified these issues, nothing had been done to resolve them, as leaders did not trust the data until it came from the voice of the teams via AgilityHealth.

The ROI of slowing down to speed up

Equipped with this knowledge, leaders took the time to slow down and ensure teams had what they needed to perform their jobs efficiently. Leaders also developed a better understanding of where they needed to step in to help the teams. The organization re-focused efforts on building a sufficient backlog, aligned with a roadmap, so teams could identify dependencies earlier in the development lifecycle. 

This intentional slow-down drove a return on investment in less than a year and $6M in cost savings—equivalent in productivity to the work of five extra teams—while generating an additional $25M in value for the company.

By leveraging the results of the AgilityHealth assessment, leaders now had the data they needed to take action:

  • A repeatable process for collecting and measuring continuous improvement efforts at the end of every planning increment (PI)
  • Clear understanding of where teams stood in their Agile journey and next steps for maturity
  • Comprehensive baseline assessment results showing where individual team members thought improvement was needed, both from leaders and within their teams

What’s next

An enterprise transformation doesn’t stop with the first round of assessments. Like other Fortune 500 companies, this client plans to continue scaling growth and maturity across the enterprise, increasing momentum and building on what it’s learned.

The company plans to introduce the Agility Health assessment for individual roles, so it can measure role maturity and accelerate the development of Agile skills across defined competencies. It will continue to balance technical capacity with an emphasis on maintaining stable, cross-functional teams since these performance metrics correlate to shipping products that delight customers and grow the business. And to better facilitate “structural agility” (creating and tracking Agile team structures that support business outcomes), it will focus on ensuring the integrity of its data.

Get started

You too can leverage AgilityHealth’s Insights Dashboard to get an overall view of your organization’s Agile maturity: baseline where you are now, discover how to improve, and get to where you want to be tomorrow. Get started by logging into the SAFe Community and visiting the Measure and Grow page.

About Sally

Sally is a thought leader in the Agile and business agility space

Sally is a thought leader in the Agile and business agility space. She’s passionate about accelerating the enterprise business agility journey by measuring what matters at every level and building strong leaders and strong teams. She is an executive advisor to many Fortune 500 companies and a frequent keynote speaker. Learn more about AgilityHealth here.

Share:

Back to: All Blog Posts

Next: 8 Patterns to Set Up Your Measure and Grow Program for Success

How to Scale Up the Circular Economy

This blog post will illustrate, with practical examples, how the principles and practices of the Scaled Agile Framework® (SAFe®) can contribute to scaling up the circular economy. 

The circular economy offers opportunities for better growth through an economic model that is resilient, distributed, diverse, and inclusive. It tackles the root causes of global challenges such as climate change, biodiversity loss, and pollution, creating an economy in which nothing becomes waste, and which is regenerative by design.

Many enterprises are committed to making their products eco-friendlier and participating in global coalitions such as The Plastics Pack. Nevertheless, due to the lack of global standards or lack of dialogue and collaboration, they could create fragmented, small-scale, and sub-optimal solutions. For example, an enterprise might design a product that contains recyclable materials, is built with mono-material components, and is easy to disassemble. Still, it would only maximize its recycling value when embedded in a functioning collection system and treated in proper recycling facilities.

What Is the Solution, Then?

Circularity is a property of a system and not of individual products. It depends on how different actors, products, and information interact with each other. Improving the whole system would require that a group of loosely coupled actors combine their business models to achieve a better collective outcome. The proposed solution is a virtual organization that aligns the strategy and execution of all the stakeholders creating a solution ecosystem.

Let’s look at one example. I will illustrate a management framework to improve the packaging plastics system shown below.

Scale Up the Circular Economy

Applying SAFe Principles to the Circular Economy

SAFe principle #10, Organize around value, recommends creating a virtual organization that would maximize the flow of value. It involves eliminating silos and barriers for collaboration, including the people, the processes, and the tools, from all relevant stakeholders that are trying to achieve the same outcome.

This organization would be called a solution ecosystem, and its goal will be to implement the desired changes. Following SAFe principle #2, Apply systems thinking, the solution ecosystem would include all the actors involved in or impacted by the flow of packaging plastics, from business, government, scientists, and NGOs to end-user communities, including all the necessary activities and information flows required. Decisions would be made collaboratively, iteratively, and based on science-based targets.

The objective of the solution ecosystem would be to deliver a series of interventions to improve the flow of plastics iteratively. The teams would validate each intervention hypothesis through a series of minimum viable products following a roadmap. An intervention example could be, “to get the top 20 manufacturers of packaging plastics to commit to plastic packaging that’s 100% reusable, recyclable, or compostable by 2025,” while the desired outcome would be “to reduce packaging plastics flowing into the ocean by 50%.”

The solution ecosystem comprises small, long-standing, cross-stakeholder, and cross-functional teams or teams of teams dedicated to addressing specific outcomes. They will also have access to part-time specialized resources and count on all the necessary skills to deliver value independently of other teams.

The solution ecosystem could be coordinated top-down, from organizations such as the World Economic Forum, or led by a single enterprise coordinating with all the stakeholders impacted by its products. This organization could reach out vertically to all actors along the supply chain, such as those in logistics, packaging, and wholesale, horizontally to competitors, or circularly to all stakeholders impacted. 

Aligning Strategy to Execution

The solution ecosystem is likely to be composed of many people and organizations. To align strategy and execution, SAFe proposes to create a golden thread. From a single and shared vision to strategic themes to a common backlog of interventions to hold and prioritize all the interventions that will realize those themes.

The overarching vision of the New Plastics Economy is that plastics never become waste. Instead, they re-enter the economy as valuable technical or biological nutrients, creating an effective after-use plastics economy, drastically reducing the leakage of plastics into natural systems, and decoupling plastics from fossil feedstocks.

Scale Up the Circular Economy

Strategic themes are the way to achieve that vision or areas of investment. They are a way to group and classify Interventions. The solution ecosystem’s scientific community would express them in objectives and key results (OKRs). Thus, providing a qualitative and quantitative measurement to evaluate progress and success. An example could be:

Objective: Drastically reduce leakage of plastics into natural systems.

  • Key result 1: Improve after-use infrastructure in high-leakage countries by x% 
  • Key result 2: Increase the economic attractiveness of keeping materials in the system
  • Key result 3: Increase investments in efforts related to substances of concern by x %

The teams would strive to accomplish the strategic themes by implementing a series of interventions.  The solution ecosystem’s backlog is the prioritized list of interventions to be done. For example, it might look like this:

  1. Bio-benign materials
  2. Reversible adhesives 
  3. Super-polymer
  4. Plastics toolkit for policymakers 
  5. Bid data service to track the flow of dangerous chemicals
  6. Food delivery containers as a service

Collaborative Decision-making Process

SAFe recommends using Participatory Budgeting (PB) as a tool for budget allocation across the same enterprise business units. We could expand PB for multi-stakeholder decision-making, as many municipalities use it, gathering all the stakeholders’ voices. All the stakeholders impacted would be heard, voice their concerns, choose their priorities, and learn about other stakeholders’ concerns. The PB process should be done periodically to create a rolling wave agreed plan.

Creating a Balanced Portfolio

To maintain a well-balanced portfolio, SAFe proposes several budget guardrails:

  • Capacity allocation: This technique classifies interventions into different types and allocates a percentage of the available capacity to each kind, such as building the basic science, writing communications material for end-users, or drafting policy documents. Every three months, we can decide the percentage allocation to each type, keeping the desired balance across all categories.
  • Investment horizons: Classifying interventions by their impact timeframe allows leadership to maintain the right balance between the immediate, short, and long term. Quick wins are needed to win the hearts and minds of the naysayers, while the more difficult things usually take longer.
  • Epic approval: Decentralizing decision making is fundamental to reduce time-to-market and to improve flow. Nevertheless, substantial initiatives that impact multiple stakeholders need to go through an approval process based on a short business case. 

Project to Product

The traditional project approach would have required well-defined Interventions with fixed scope, fixed budget, and a fixed timeframe, such as building a clearly defined database of biomaterials at the cost of £2m over one year. One major drawback of this approach is that the success criteria of the intervention usually focus more on staying within these artificial constraints rather than on achieving the desired outcome of increasing the percentage of biomaterials used in packaging plastics by x%. Another problem is that designs and plans must be agreed upon upfront to obtain funding and approval. At that moment is when we know the least about the problem and the solution. Hence, it becomes harder to pivot later if needed.

The book Project to Product proposes a product approach, where funding is associated with long-standing teams working on a set of interventions related to the desired outcome. They would iteratively validate hypotheses and measure progress irrespective of the validity of their initial plans and assumptions. Products must be launched and maintained during their life cycle and have multiple target users with evolving needs. 

For instance, the budget would be related to a product called ‘biomaterials for packaging,’ including research, product launch, product support in life, and end-of-life activities, rather than related to a project to launch a new packaging material.

Timeboxing

SAFe principle #1, Take an economic view, proposes that we work incrementally and iteratively. Working in small timeboxes and on small pieces of independently valuable work would allow us to obtain the best economic outcome. We will get quick feedback; the value will get accumulated over time, and it will enable us to test our hypothesis and pivot quickly if needed.

SAFe principle #7, Cadence and synchronization, promotes that all teams involved in the solution ecosystem get together every three months to collaboratively plan the work for the next three months. This recurrent process helps evaluate progress toward the shared outcome, manage cross-team dependencies, and facilitate cross-team collaboration to create a stable and predictable rhythm of key events. 

Every three months, all teams demonstrate their accomplishments to evaluate progress objectively. They would get together to reflect on how they deliver value and look for opportunities to improve the process.

Epic Owner

The Epic Owner is a new role that would work at the solution ecosystem level to track and shepherd the intervention through its life cycle and across all the teams involved. In our example, the Epic Owner for the biomaterials database would be accountable to define the scope, building the short business case, getting it approved, building the teams across all stakeholders, tracking progress, being a consultant to the delivery teams, and evaluating whether they are meeting the desired outcome. It is a role, not a title. Hence, it might be fulfilled by a group of people.

Transparency

Transparency and visualization of all the work and all the dependencies by everyone are key. Kanban boards would allow us to see every intervention’s status to match demand with available capacity. A dependency board would show when each intervention will be delivered and its dependencies with other teams.

Decentralized Decision-making

No amount of central planning will be enough at this scale. To enable decentralized decision-making, we need to create a framework that provides organizational clarity and technical competence. This would allow individual teams to make decisions independently with the confidence that those will be good decisions. An example could be that a team can decide to increase the cost of the solution up to £1,000 to produce an additional reduction on the amount of plastics leakage into the ocean, as long as there is no impact on any of the other planetary boundaries.

References and Sources of Inspiration

Several reports are calling for organizations like the proposed solution ecosystem that could lead a multi-stakeholder systemic change:

  • The Metabolic Institute proposed that The Netherlands implements a regional ecosystem approach to scale up circular economy innovation.
  • The Ellen MacArthur Foundation calls for a global, independent collaboration initiative that brings together all actors across the value chain from consumer goods companies, plastic packaging producers, plastics manufacturers to cities, businesses involved in the collection, sorting and reprocessing, policymakers, and NGOs.
  • J. Konietzko writes, “Ecosystem innovation aims at changing how actors relate to each other and how they interact to achieve the desired outcome… circular products and services often maximize their circularity in conjunction with other assets. A circular ecosystem perspective thus goes beyond the question, what is our value proposition? Instead, it asks, how does our offering complement other products and services that together can provide a superior and circular ecosystem value proposition?”
  • D. Meadow, in her book Thinking in Systems, says, “You can’t predict a system, but you can dance with it.” Hence, do not design a solution upfront at the enterprise level, expecting the whole ecosystem to react as you hoped. Instead, implement a management framework that allows you to work iteratively at the system level, which we call the solution ecosystem; listen to the feedback, and react accordingly. 

Conclusion

In this blog post, I proposed a management framework, adapted from the Scaled Agile Framework, to manage a multi-stakeholder ecosystem to scale up solutions for the circular economy. At this stage, these are ideas extrapolated from my experience in business agility transformations and my readings into the circular economy. Please get in touch with me via LinkedIn to explore these ideas further, or if you have a concrete initiative you would like to apply them to.

About Diego Groiso

Diego Groiso Scaled Agile Partner

As a Principal Consultant at Radtac, a Scaled Agile Partner, Diego supports companies in their Business Agility journeys as an Enterprise Agile Coach, Trainer, and Release Train Engineer. Recently, he has transformed the whole infrastructure department of a global utility company, as well as launched and coached several Agile Release Trains within the Digital Transformation Programme in a global telecom company. He has a passion for the circular economy as one of the solutions to climate change. Connect with Diego on LinkedIn.

Share:

Back to: All Blog Posts

Next: Aligning Global Teams Through Agile Program Management: A Case Study

AgilityHealth Insights: What We Learned from Teams to Improve Performance – Agility Planning

This post is part of an ongoing blog series where Scaled Agile Partners share stories from the field about using Measure and Grow assessments with customers to evaluate progress and identify improvement opportunities.

At AgilityHealth®, our team has always believed there’s a correlation between qualitative metrics (defined by maturity) and quantitative metrics (defined by performance or flow). A few years ago, we moved to gather both qualitative and quantitative data. Once we felt we had a sufficient amount to explore, we partnered with the University of Nebraska’s Center for Applied Psychological Services to review the data through our AgilityHealth platform. The main question we wanted to answer was: What are the top competencies driving teams to higher performance? 

Before we jump into the data, let’s start by reviewing what metrics make up “performance.” Below are the five quantitative metrics that form the Performance Dimension within the TeamHealth® radar: 

  • Time-to-market 
  • Quality
  • Predictable Delivery
  • Responsiveness (cycle time)
  • Value Delivered
AgilityHealth

During the team assessment, we ask the team and the product owner about their happiness and their confidence in their ability to meet the current goals. We consider these leading indicators for performance, so we were curious to see what drives the qualitative metrics of Confidence and Happiness as well. 

Methodology 

We analyzed both quantitative and qualitative data from teams surveyed between November 2018 and April 2021. There were 146 companies representing a total of 4,616 teams (some who took the assessment more than once) which equates to more than 46,000 individual survey responses.

We used stepwise regression to explore and identify the top five drivers for each outcome. Stepwise regression is one approach in building a model that explains the most predictive set of competencies for the desired outcome. 

The results of our analysis identified the top five input drivers for each of the performance metrics in the TeamHealth assessment, along with the corresponding “weight” of each driver. We also uncovered the top five drivers of Confidence and Happiness for teams and product owners. These drivers are the best predictors for the corresponding metrics. All drivers are statistically significant, and each metric has the driver’s ranked order. 

By focusing on increasing these top five predictors, teams should see the highest gain on their performance metrics. 

Results

 After analyzing the top drivers for each of the performance metrics, we noticed that a few kept showing up as repeat drivers across performance. 

AgilityHealth

When analyzing the drivers for Confidence and Happiness, we found these additional predictors:

AgilityHealth

We know from experience that shorter iterations, better planning and estimating, and T-shaped skills all lead to better performance—but we now have data to prove it. It was a welcome surprise to see self-organization and creativity take center stage, as it did in our analysis. We’ve always coached managers to empower teams to solve problems, but for the first time, we have the data to back it up. 

Recommendations

Pulling these patterns together, it’s clear that if a team wants to impact its performance in an efficient way, it should focus on weekly iterations, T-shaped team members, effective planning and estimating, enabling creativity and self-organization, role clarity, and right-sizing and skilling. Teams that invested in these drivers saw a 37 percent performance improvement over teams that didn’t. So when in doubt, start here!

We’re excited to share that you can now see the drivers for each competency inside the AgilityHealth platform. We hope it helps you make informed decisions about where to invest your time and effort to improve your performance.

Visit the AgilityHealth page on the SAFe® Community Platform to learn more about these assessment tools and get started!

About Sally

Sally- Agile and business agility space

Sally is a thought leader in the Agile and business agility space. She’s passionate about accelerating the enterprise business agility journey by measuring what matters at every level and building strong leaders and strong teams. She is an executive advisor to many Fortune 500 companies and a frequent keynote speaker. Learn more about AgilityHealth at https://www.agilityhealthradar.com.

Share:

Back to: All Blog Posts

Next: How Do We Measure Feelings?

Creating Your PI Backlog Content – Agility Planning

Glenn Smith and Darren Wilmshurst with Radtac, a Scaled Agile Partner, co-wrote this blog post. 

At the conclusion of Program Increment (PI) Planning, we’re always reminded of something one of our colleagues always says. There’s much to celebrate because we’ve created a set of committed plans. But we first have to complete a retrospective of the PI Planning event (cue groans from everyone in the room) and we “start preparing tomorrow” for the next PI (more groans).

Moreover, the critical path for any PI Planning is the creation of the content, suitably refined and prioritized. Without this, we can’t do any planning! But what does this look like in practice? 

This blog post is aimed at coaches who need to think about the content preparation for the next PI. By that we mean SAFe® Program Consultants (SPCs) supporting the Agile Release Train (ART) and Release Train Engineers (RTEs). But more importantly, Product Management (PM) and System Architects (SA) need to create, refine, prioritize, and socialize the content supported by Product Owners (POs) and Business Owners (BOs). We will explore each of these roles in turn during the course of this post. 

The traditional siloed hierarchy of organizations can engender a ‘this isn’t my job’ attitude. Yet many people and roles need to work together to create a compelling backlog that delivers economic benefits and satisfies your customers.

The visual model below is a high-level view of the intensity of the preparation activity for each of these roles. It isn’t meant to represent the number of hours. That is, high intensity does not mean 100 percent of your time, we just expect more time spent on preparation while recognizing that there will be other things to be done.

PI Backlog Content
Preparation intensity for specific roles.

You will also notice that there is a significant spike in preparation during the Innovation and Planning (IP) Sprint for PM, BOs, POs, and the Teams. This is when PI Planning happens.

Product Management and System Architect

PM and the SA will follow a similar pattern to each other, as their roles are two sides of the same coin—one focused on the outward market and the other technically oriented. They are going to be collaborating and working closely to make sure their respected needs are met and the right balance of the work is correctly scheduled.

Crafting backlog items for an ART, whether they are Business Features or Enabler Features, follow a pattern of Creating, Refining, Prioritising, and Socialising. While overly simplistic, each step could follow the first four iterations of a PI. In the first half of the PI, expect PM and the SA to be looking to the future. This will include looking at upcoming Epics, decomposing existing Epics, and the ART roadmap and associated Architecture Runway.

A common pattern is to see poorly defined Features with weak benefit hypothesis statements and acceptance criteria. It shouldn’t be overlooked how much effort this takes to do well. This is because the work involved isn’t just writing them down in your Agile Lifecycle Management tooling, but working with BOs, talking to a wider stakeholder cohort, including customers, and reviewing market trends. Improving their own understanding of the value proposition and scope enables people on the ART to more easily deliver against it. Through the PI, their effort tapers as other cohorts take the backlog content and prepare for PI Planning.

Business Owners

BOs are key stakeholders and critical friends of the ART. As such, they gradually experience an increasing demand on their time to support creating backlog content throughout the PI—with the most involvement happening during PI Planning. As a cohort, BOs are available when needed by the likes of PM, and actively participate in the System Demos every iteration. Here, they not only get to see the progress of delivery but give feedback to help PM and the POs inspect and adapt the backlog.

We recommend that prioritization be a ‘little and often’ affair. And as it is a team sport, BOs must attend these sessions (these are the little spikes on the BO line in the model).

Product Owners

In a scaled environment, POs serve both the team and the train. In the initial periods of the PI, as you might expect, the PO has both a team execution focus and needs to support PM with Feature creation and refinement. As the content starts to get in better shape for the upcoming PI Planning, PO involvement increases, but with a shift in focus to Feature elaboration and decomposition into drafting user stories to later socialize with the team.

The Team

Through most of the PI, the team is execution-focused, although on hand for those ad hoc, short whiteboard sessions with PM, SAs, and POs. Larger demands on the team’s time should be scheduled like any other demand on their time—after all, work is work! This will be done through the use of exploration enablers in a future PI, or spikes and innovation activities that occur during the IP iteration. Either way, the outcome is gaining knowledge that reduces the uncertainty of future work.

The team’s involvement, however, peaks during the IP iteration when the POs socialize the upcoming backlog of work—the Features and the draft stories they have created. It is during the preparation for PI Planning that the team takes time to understand what is needed and answer questions that need “I’ll look in the code” to find out.

Release Train Engineer and Scrum Master

Hey wait, you didn’t forget about the RTE and Scrum Master (SM), did you? Surely they are just facilitators, we hear you say, what do they have to do with backlog items? But let’s think about this. As facilitators at the train or team level, they are key advocates for the improvement of flow and value delivery. Therefore, it is not unreasonable to expect them to create improvement items that require effort from the teams during the PI. And we know that anything that requires effort from the teams should be planned accordingly.

The items that the RTE and SM will bring to the table for inclusion will likely come from team retrospectives, the Inspect and Adapt problem-solving workshop, or from insight gained from activities like the SAFe® DevOps course.

Creating Content During PI Planning

During each PI Planning session, PM presents the vision, which highlights the proposed features of the solution, along with any relevant upcoming Milestones. While some may feel that at this point in the proceedings the content creation is over for PM, there is actually still work to do. During the planning, there will likely be scope negotiations and prioritization calls needed as the teams get deeper into understanding and scheduling in their breakout sessions.

Similarly, the BOs have a role in adaptive content creation too. Beyond providing the business context in the briefings, they will work with the team to discuss the needed outcomes from the work. And they’ll support PM and the SAs in adapting the scope from what was originally crafted—because tradeoffs need to be made during planning. Discussions with the teams during the assignment of Business Value could influence what gets produced in the upcoming PI too.

While the POs and the Teams need to sequence and plan their stories to maximize economic results, there will almost certainly be variability of scope that will need to be accommodated as new information emerges. This will involve further elaboration, negotiation, planning, and reworking of the content during PI Planning.

In addition, the model shouldn’t be followed religiously, but used to identify who, when, and by how much focus the different roles on the train need to spend to make this happen. While putting an emphasis on the quality of the backlog items is going to help your ART, it alone won’t fix your delivery problems but will act as a key enabler in doing so. 

It is important to give a government health warning at this stage: context is king! While we have given our view on the preparation activities and the intensity, your context will provide a different reflection. In fact, when creating this post, we both had a slightly different approach for prioritization based on our respective experiences. Neither is right or wrong but a reflection on the clients that we have worked with. So please treat the model we have created as a ‘mental model’ and something you can use with your trains to frame a discussion. 

The pattern, while broadly accurate, will change in some situations, particularly if you are preparing for a training launch and this is your first PI. Here, the cadence may be condensed and more focused, but this will be guided by the quality of the backlog content you already have.

A final thought and back to our colleague who says that “PI Planning starts tomorrow.” So does PI Execution. There’s no point in making a team committed to the plans that you have created and then not executing on them. Otherwise, what was the point of PI Planning in the first place?

If we’ve piqued your interest, check out this post about changing a feature in the middle of the PI. It’s a question we always get asked when we teach the Implementing SAFe® class.

About Glenn

Blog author Glenn Smith headshot

Glenn Smith is SAFe Program Consultant Trainer (SPCT), SPC, and RTE working for Radtac as a consultant and trainer out of the UK. He is a techie at heart, now with a people and process focus supporting organizations globally to improve how they operate in a Lean-Agile way. You will find him regularly talking at conferences and writing about his experiences to share his knowledge.

Share:

Back to: All Blog Posts

Next: We’re Giving More Than a Donation for Pride Month

Three Steps to Prepare for a Successful Value Stream Workshop – SAFe Transformation

two people talking to each other at a Value Stream Workshop

The Value Stream and Agile Release Train (ART) identification workshop are some of the most critical steps to generate meaningful results from your SAFe transformation. That’s because it enables you to respond faster to customer needs by organizing around value. This workshop can also be the hardest step. It’s complex and politically charged, so organizations often skip or mismanage it.

A savvy change agent would invest in the organizational and cultural readiness to improve the chances of its success. Attempting to shortcut or breeze through change readiness would be the same as putting your foot on the brake at the same time you’re trying to accelerate. Get this workshop right, and you’ll be well on your way to a successful SAFe implementation.

Why Is It So Difficult? 

Aside from the complex mechanics of identifying your value streams, there is also a people component that adds to the challenge. Leaders are often misaligned about the implications of the workshop, and it can be tough to get the right participants to attend.  For example, a people leader could soon realize that ARTs may be organized in a way that crosses multiple reporting relationships, raising the concern of their direct reports joining ARTs that don’t report to them. 

In reflecting on my battle scars from the field, I’ve distilled my advice to three steps to prepare the organization for a successful workshop.

Step 1: Engage the right participants

The Value Stream and ART identification workshop can only be effective and valuable if the right audience is present and engaged. This is the first step to ensure the outcome of the workshop solves for the whole system and breaks through organizational silos.

“… and If you can’t come, send no one.” —W. Edwards Deming

The required attendees will fall into four broad categories:

  • Executives and leaders with the authority required to form ARTs that cut across silos.
  • Business owners and stakeholders who can speak to the operational activities of the business, including ones with security and compliance concerns.
  • Technical design authorities and development managers who can identify impacted systems and are responsible for the people who are working on them.
  • Lean-Agile Center of Excellence and change agents supporting the SAFe implementation and facilitating the workshop.

Use some guiding questions to identify the right audience for the workshop within your organization. Are the participants empowered to make organizational decisions? Do the participants represent the whole value stream? Is the number of attendees within a reasonable range to make effective decisions?

Step 2: Build leadership support and pre-align expectations

To support engagement and address potential resistance, I recommend performing a series of interactions with leaders in advance of the workshop. In such interactions, the change agent would socialize a crisp and compelling case for change in the organization, supporting the “why” behind running the workshop.

The change agent needs to be prepared to address leader trepidation about the possibility of having their reporting-line personnel on ARTs that they don’t fully own.  Most compelling is a data-based case made by performing value-stream mapping with real project data to expose the delays in value delivery due to organizational handoffs. 

Interaction opportunities can include one-on-one empathy interviews, attending staff meetings, internal focus groups, and overview sessions open to all workshop participants. 

I highly advise setting expectations with leaders in advance of the workshop. This will help them understand the workshop implications, help identify potential misalignment or resistance, and coach them in how to signal support for the workshop purpose.  

The following are useful expectations to set with the participants in advance to help shape how they view the upcoming workshop:

  • Allow the designs to emerge during the session. This is meant as a collaborative workshop.
  • Expect to be active and on your feet during the session, actively contributing to the designs.
  • Be present and free up your schedule for the duration of the workshop as key organizational decisions are being made.
  • Alleviate the anxiety of broad, big-bang change by clarifying that they get to influence the implementation plan and timing to launch the ARTs.
  • Address the misconception about organizational change by explaining that ARTs are “virtual” organizations, and that reporting lines need not be disrupted.
a group of office workers during a Value Stream Workshop

Step 3: Prepare the workshop facilitators

A successful Value Stream and ART identification workshop will have the main facilitator, ideally someone with experience running this workshop. Additionally, you’ll need a facilitator, typically an SPC, per every group of six to eight attendees. Prior to the workshop date, schedule several facilitator meetings to prepare and align them on the game plan. This will go a long way in helping your facilitators project competence and confidence during the workshop. Discuss the inherent challenges and potential resistance, and how the facilitators can best facilitate such moments. Share insights on change readiness based on the leadership interactions and empathy interviews. Finally, prepare a shared communication backchannel for facilitators, and build in sync points during the event to ensure alignment across the groups.

While these simple steps and readiness recommendations don’t necessarily guarantee a successful workshop, they’re a great starting point. You’ll still need to understand the mechanics of identifying value streams. This is what Adam will cover in the next post in our value stream series. Look for it next week.

In the meantime, check out the new Organize Around Value page on the SAFe Community Platform.

About Deema Dajani

Deema Dajani is a Certified SAFe® Program Consultant Trainer (SPCT).

Deema Dajani is a Certified SAFe® Program Consultant Trainer (SPCT).
Drawing on her successful startup background and an MBA from Kellogg Northwestern University, Deema helps large enterprises thrive through successful Agile transformations. Deema is passionate about organizing Agile communities for good, and helped co-found the Women in Agile nonprofit. She’s also a frequent speaker at Agile conferences and most recently contributed to a book on business agility.

View all posts by Deema Dajani

Share:

Back to: All Blog Posts

Next: Leading the SAFe® Conversation to Win Over Your Peers