Can SAFe Make the World a Better Place?

Recently, someone asked me to explain the benefits of SAFe® over other Agile frameworks. Before I answer, I want to point out that I am not opposed to other scaling frameworks (we don’t do that!). What I can do, however, is speak from my own experience and give you some insight into why I choose to specialise in SAFe.

One of the best books I read last year was Switch: How to change things when change is hard, by Chip and Dan Heath. The book talks about communicating a vision and uses a great analogy of the elephant and the rider. The rider represents the rational self, and the elephant the emotional self. If the rational brain interests you, I suggest you look at the customer stories at the Scaled Agile website. There you can explore a treasure trove of case studies based on data.

I’m going to focus on the elephant. A common question in SAFe classes is where the data sits behind the statistic, “30 percent increase in employee engagement.” I usually answer this question by telling a true story about a Programme Manager I worked with called Steve (his real name isn’t Steve). 

Steve worked in a large organisation for 20 years. Over the years, he honed his craft by emulating those who had gone before him. He worked his way up the project management ladder and became highly respected by all who had the pleasure of working with him. There was just one problem, Steve had learned that the best way for his projects to succeed was to be at the centre of everything. Every decision went through him, and every status report had to be filled out precisely the way he did it; if not, you would have to do it again. Now, this all sounds sensible: Steve knew what his stakeholders needed to know, and he made sure that they had the information they needed to sail through his milestones with minimal fuss. There was one fly in the ointment: Steve had to work 60 hours a week to maintain control.

The organisation that Steve works in decided to go SAFe and identified his programme as an ideal candidate to launch an ART. Steve was willing to try but was sceptical about a new approach. We followed the SAFe Implementation Roadmap, trained everyone and got ready for PI planning. This is the point in our story when everything changed.

In the first PI planning, the room’s energy was unlike anything seen before. Because everyone who needed to be there was in the same room, the teams managed to unblock a capability in the first hour of the first team breakout that had stumped everyone for three months. The momentum continued to build from there; the ART launch was a tremendous success.

To understand why I think SAFe is so brilliant, we need to fast forward a few PIs. It was the summer season, and Steve took some time off to relax and soak up the sun. For the first time in years, Steve was not on his phone. He was not checking emails. He relaxed. When I caught up with him shortly after his holiday, he said, “Thanks to SAFe, I’ve got my life back.” Steve was no longer working crazy hours to stay in control. He had let go of many day-to-day decisions. He trusted the teams to make the calls on the things they were close to so that he could focus on the strategy.

I believe that SAFe is so fantastic because it gives us just the right balance of guidance and flexibility. The 10 SAFe Principles help us put the changes in behaviour into practice. As a coach, they are at the front of my mind whenever I’m thinking about implementing SAFe. And for people like Steve, they help put the mindset into practice and apply it to their own context. We can’t be overly prescriptive; every context is different. 

Steve’s story is far from unique; I’ve seen many people’s lives change for the better as they embrace a new way of working. That is why I do what I do. Business benefits are essential, the ability to respond to changes in the market is critical, but I’m all about the people. 

It’s no accident that the first value of the Agile Manifesto is individuals and interactions over processes and tools, or that the first pillar of the SAFe House of Lean is respect for people and culture. What could be more important than making the world a better place for people to work? What could be more valuable than improving the happiness and wellbeing of our people?

So, can SAFe make the world a better place? I believe so!

About Tim

Tim is an experienced SPCT

Tim is an experienced SPCT who has been working in Agile and software for the last 12 years. Over the years, Tim has worked in a variety of industries such as telecom, pharma, and aviation, leading large transformation initiatives. Connect with Tim on LinkedIn.

AgilityHealth Insights: What We Learned from Teams to Improve Performance – Agility Planning

This post is part of an ongoing blog series where Scaled Agile Partners share stories from the field about using Measure and Grow assessments with customers to evaluate progress and identify improvement opportunities.

At AgilityHealth®, our team has always believed there’s a correlation between qualitative metrics (defined by maturity) and quantitative metrics (defined by performance or flow). A few years ago, we moved to gather both qualitative and quantitative data. Once we felt we had a sufficient amount to explore, we partnered with the University of Nebraska’s Center for Applied Psychological Services to review the data through our AgilityHealth platform. The main question we wanted to answer was: What are the top competencies driving teams to higher performance? 

Before we jump into the data, let’s start by reviewing what metrics make up “performance.” Below are the five quantitative metrics that form the Performance Dimension within the TeamHealth® radar: 

  • Time-to-market 
  • Quality
  • Predictable Delivery
  • Responsiveness (cycle time)
  • Value Delivered
AgilityHealth

During the team assessment, we ask the team and the product owner about their happiness and their confidence in their ability to meet the current goals. We consider these leading indicators for performance, so we were curious to see what drives the qualitative metrics of Confidence and Happiness as well. 

Methodology 

We analyzed both quantitative and qualitative data from teams surveyed between November 2018 and April 2021. There were 146 companies representing a total of 4,616 teams (some who took the assessment more than once) which equates to more than 46,000 individual survey responses.

We used stepwise regression to explore and identify the top five drivers for each outcome. Stepwise regression is one approach in building a model that explains the most predictive set of competencies for the desired outcome. 

The results of our analysis identified the top five input drivers for each of the performance metrics in the TeamHealth assessment, along with the corresponding “weight” of each driver. We also uncovered the top five drivers of Confidence and Happiness for teams and product owners. These drivers are the best predictors for the corresponding metrics. All drivers are statistically significant, and each metric has the driver’s ranked order. 

By focusing on increasing these top five predictors, teams should see the highest gain on their performance metrics. 

Results

 After analyzing the top drivers for each of the performance metrics, we noticed that a few kept showing up as repeat drivers across performance. 

AgilityHealth

When analyzing the drivers for Confidence and Happiness, we found these additional predictors:

AgilityHealth

We know from experience that shorter iterations, better planning and estimating, and T-shaped skills all lead to better performance—but we now have data to prove it. It was a welcome surprise to see self-organization and creativity take center stage, as it did in our analysis. We’ve always coached managers to empower teams to solve problems, but for the first time, we have the data to back it up. 

Recommendations

Pulling these patterns together, it’s clear that if a team wants to impact its performance in an efficient way, it should focus on weekly iterations, T-shaped team members, effective planning and estimating, enabling creativity and self-organization, role clarity, and right-sizing and skilling. Teams that invested in these drivers saw a 37 percent performance improvement over teams that didn’t. So when in doubt, start here!

We’re excited to share that you can now see the drivers for each competency inside the AgilityHealth platform. We hope it helps you make informed decisions about where to invest your time and effort to improve your performance.

Visit the AgilityHealth page on the SAFe® Community Platform to learn more about these assessment tools and get started!

About Sally

Sally- Agile and business agility space

Sally is a thought leader in the Agile and business agility space. She’s passionate about accelerating the enterprise business agility journey by measuring what matters at every level and building strong leaders and strong teams. She is an executive advisor to many Fortune 500 companies and a frequent keynote speaker. Learn more about AgilityHealth at https://www.agilityhealthradar.com.

Share:

Back to: All Blog Posts

Next: How Do We Measure Feelings?

How Do We Measure Feelings? – SAFe Transformation

This post is part of an ongoing blog series where Scaled Agile Partners share stories from the field about using Measure and Grow assessments with customers to evaluate progress and identify improvement opportunities.

As business environments feature increasing rates of change and uncertainty, agile ways of working are becoming the dominant way of operating around the globe. The reason for this dominance is not that agile is necessarily the “best” way of working (agile, by definition, embraces the idea that you don’t know what you don’t know) but because businesses have found agile better-suited to addressing today’s challenges. Detailed three-year plans, extensive Gantt charts, and work breakdown structures simply have less relevance in today’s world. Agile, with its emphasis on fast learning and experimentation, has proven itself to be more appropriate for today’s unpredictable business environment.

Agility Requires Data You Can Trust

Whereas a plan-driven approach requires an extensive analysis phase, today’s context demands frequent access to high-quality data and information to facilitate quick course correction and validation. One of these critical sources of data is targeted assessments. The purpose of any assessment is to gather information. And the quality of the information collected is a direct result of the quality of the assessment. 

Think of an assessment as a measuring tool. If we were studying a physical object, we might use measuring devices to assess its length, height, mass, and so on. Scientists have developed sophisticated definitions of many of these physical characteristics so we can have a shared understanding of them.

However, people—especially groups of people—are not quite so straightforward to measure: particularly if we’re talking about their attitudes and feelings. It’s not really possible to directly measure concepts like culture and teamwork in the same way we can measure mass or length. Instead, we have to look to the discipline of psychometrics—the field of study dedicated to the construction and validation of assessment instruments—to assist us in measuring these complex topics.

Survey researchers often refer to an assessment or questionnaire as an “instrument,” because the purpose is to measure. We measure to learn, and we learn to apply our knowledge in pursuit of improvement. This is one reason why assessment is such an integral part of the educational system. Properly designed, assessments can be a powerful tool to help us validate our approach, understand our strengths, and identify areas of opportunity.

Ensuring Quality is Built into the Assessment

Since meaningful information is so critical to fast inspection and adaptation, it’s important to use high-quality assessments. After all, if we’re going to leverage insights from the assessments to inform our strategy and guide our decisions, we need to be confident we can trust the data.

How do we know that an assessment instrument is measuring what it purports to? It’s so important to use care when designing the assessment tool, and then use data to provide evidence of both its validity (accuracy) and reliability (precision). Here’s how we ensure quality is built into our assessment.

Step 1: Prototype

All survey instrument development starts with a measurement framework. When Comparative Agility partnered with SAFe® to design the new Business Agility assessment, subject matter experts leveraged their experience from the original Business Agility survey to explore enhancements. 

The original Business Agility survey had generated a variety of important insights and proved to be incredibly popular among SAFe customers. But one area of potential improvement was the language used in the assessment itself. Customers wanted to leverage a proven SAFe survey to understand an organization’s current state, without first requiring the organization to have gone through comprehensive training. With the former Business Agility survey, this proved difficult, since the survey instrument often referred to SAFe-specific topics that many had not been exposed to yet.

To address this issue, subject matter experts (SPCTs, SAFe Fellows) teamed up with data scientists from Comparative Agility to craft SAFe survey items that would be meaningful at the start of a SAFe implementation, while avoiding terms that would require prior knowledge. This work resulted in a prototype survey or “minimum viable product.” 

Step 2: Test and Validate

Once the new Business Agility survey instrument was developed, we released it to beta and began to collect data. Several people in the SPCT community were asked to participate in a pilot. In follow-up interviews, respondents were asked about their experience with the survey. Together with respondents, the survey design team, and additional subject matter experts, we examined the results. (We also received external feedback from a Gartner researcher to help improve the nomenclature of some of the survey items.) Only once the team has been satisfied with the reliability and validity of the beta survey instrument will it be ready for production.

Step 3: Deploy and Monitor

Even after the Business Agility survey instrument reaches the production phase, the data science team at Comparative Agility and Scaled Agile continuously monitor the assessment for data consistency. A rigorous change management process ensures that any tweaks made to survey language, post-deployment, are tested to ensure they don’t negatively impact the accuracy.

Integrating Flow and Outcomes
Although validated assessments are a critical component of a data-driven approach to continuous improvement, they’re not sufficient. To gain a holistic perspective and complete the feedback loop, it’s also important to measure Flow and Outcomes. 

Flow
Flow metrics express how efficient an organization is at delivering value. When operating in complex environments characterized by uncertainty and volatility, flow metrics help organizations identify performance across the end-to-end value stream, so you can identify impediments to agility. A more comprehensive overview of Flow metrics can be found in the SAFe knowledge article, Metrics.

OutcomesFlow metrics may help us deliver quickly and effectively, but without understanding whether we’re delivering value to our customers, we risk simply “delivering crap faster.” Outcome metrics address this challenge by ensuring that we’re creating meaningful value for the end-customer and delivering business benefits. Examples of outcome metrics include revenue impact, customer retention, NPS scores, and Mean Time to Resolution (MTTR). 

Embracing a Culture of Data-Driven, Continuous Improvement

It’s important to note that although data and insights help inform our strategy and guide our decisions, to make change stick and ultimately to drive sustainable cultural change, we need to appreciate that data is a means to an end.

That is, data—even though it’s validated, statistically significant, and of high quality—should be viewed not as a source of answers, but rather as a means to ask better questions and uncover new insights in our interactions with people. By having data guide us in our conversations, interactions, and how we define hypotheses, we can drive a culture of inquiry and continuous improvement. 

Just like when a survey helps us better understand how we feel, the assessment provides us with an opportunity to interact in a more meaningful way and increase our understanding. The data itself is not the goal but a way to help us learn faster, adapt quicker, and remove impediments to agility.

Start Improving with Your Own Data

As 17 software industry professionals noted some twenty years ago at a resort in Snowbird, Utah, becoming more agile is about “individuals and interactions over processes and tools.” 

To start your own journey of data-driven, continuous improvement today, activate your free Comparative Agility account in the Measure & Grow area of the SAFe Community Platform.

About Matthew

Matthew Haubrich is the Director of Data Science at Comparative Agility.

Matthew Haubrich is the Director of Data Science at Comparative Agility. Passionate about discovering the story behind the data, Matt has more than 25 years of experience in data analytics, survey research, and assessment design. Matt is a frequent speaker at numerous national and international conferences and brings a broad perspective of analytics from both public and private sectors.

Share:

Back to: All Blog Posts

Next: Everything You Wanted to Know About SAFe® Enterprise (but Were Afraid to Ask)

Honest Assessments Achieve Real Insights

In this post, I share my experience of running a series of Measure and Grow assessments at a government agency in the UK I’m working with—including the experiments that we decided to run and our learnings during the SAFe transformation process.

The last year has been a voyage of discovery for all of us at Radtac. First, we had to figure out how to deliver training online and still make it an immersive learning experience. Then, we needed to figure out how to do PI Planning online with completely dispersed teams. Once that was sorted, we entered a whole new world of ongoing, remote consulting that included how to run effective Measure and Grow assessments.

In this post, I share my experience of running a series of Measure and Grow assessments at a government agency in the UK I’m working with—including the experiments that we decided to run and our learnings. The agency has already established and runs 15 Agile Release Trains (ARTs). We agreed that we wouldn’t run assessments for 15 ARTs because we wanted to start small and test the process first. Therefore, we picked four ARTs to pilot the assessments and only undertake the Team and Technical Agility and Agile Product Delivery assessments.

Pre-assessment Details

What was really important was that each ART we had selected had an agility assessment pre-briefing where we set the context with the following key messages:

  1. This is NOT a competition between the ARTs to see who had the best assessment.
  2. The assessments will support the LACE in identifying the strengths and development areas across the ARTs.
  3. The results will be presented to leadership in an aggregated form. Each ART will see only their results; no individual ART results will be shared with other ARTs.
  4. The results will identify where leadership can remove impediments that the teams face.
  5. We need an honest assessment to achieve real insight into where leadership and the LACE can help the teams.

In addition, prior to the assessments, we asked the ARTs to:

  1. Briefly review the assessment questions.
  2. Prioritise attendance with core team members with a cross-section of their team.

Conducting the Assessment

The assessment was facilitated by external consultants to provide some challenges to the responses. We allotted 120 minutes for both the Technical and Team Agility and Agile Product Delivery assessments, but most ARTs completed them within 90 minutes. We used Microsoft Teams as our communication tool and Menimeter.com (Menti) to poll the responses.

Each Menti page had five to six questions that the team members were asked to score on a scale of 1 to 5–with 1 being false, 3 being neither false nor true, and 5 is true. To avoid groupthink, we didn’t show the results until all questions and all members had been scored. Because Menti shows a distribution of scores, where there was a range in the scoring, we explored the extremes and asked team members to explain why they thought it was a 1 while others thought it was a 5. On the rare occasion that there was any misunderstanding, we ran the poll again for that set of questions.

Scaled Agile Partners
Some results from the Team and Technical Agility poll.

What we found after the first assessment was that there was still a lot of SAFe® terminologies that people didn’t understand. (Based on this and similar feedback, Scaled Agile recently updated its Business Agility assessment with simpler, clearer terminology. This is helpful for organizations that want to use it before everyone has been trained or even before they’ve decided to adopt SAFe.) So, for the next assessment, we created a glossary of definitions, and for each set of questions before they scored, we reminded them of some of the key terminology definitions.

The other learning was that for some of the questions, team members didn’t have a particular experience, and therefore scored a 1 (false) which distorted the assessment. Going forward, we asked team members to skip the question if they had no experience. We also took a short break between the assessments. And of course, no workshop would be complete without a feedback session at the end, which helped us improve each time we completed the assessments.

Here is a quote from one of the ARTs:

“As a group, we found the Agile Assessment a really useful exercise to take part in. Ultimately, it’s given our supporting team areas to focus on and allowed us to pinpoint areas where we can drive improvements. The distributed scores for each question are where we saw a great deal of value and highlighted differences in opinion between roles. This was made more impactful by having a split of engineers and supporting team roles in the session. The main challenge we had about the session was how we interpreted the questions differently. To overcome this, we had a discussion about each question before starting the scoring, and although this made the process a little longer, it was valuable in ensuring we all had the same understanding.”

Post-assessment Findings

We shared the individual ART results with its team members so that they could consider what they as an ART could improve themselves. As a LACE, we aggregated the results and looked for trends across the four ARTs. Here’s what we presented to the leadership team:

  1. Observations—what did we see across the ARTs?
  2. Insights—what are the consequences of these observations?
  3. Proposed actions—what do we need to do as a LACE and leadership team? We used the Growth Recommendations to provide some inspiration for the actions.

We then made a commitment to the teams that we would provide feedback from the leadership presentations.

Next Steps

We need to run the assessments across the other 11 ARTs and then repeat the assessments every two to three Program Increments.

You can get started with Measure and Grow, including the updated Business Agility assessment and tools on the SAFe® Community Platform.

About Darren

Darren is a director at Radtac, a global agile consulting business

Darren is a director at Radtac, a global agile consulting business based in London that was recently acquired by Cprime. As an SPCT and SAFe® Fellow, Darren is an active agile practitioner and consultant who frequently delivers certified SAFe courses. Darren also serves as treasurer of BCS Kent Branch and co-authored the BCS book, Agile Foundations—Principles, Practices and Frameworks.

Share:

Back to: All Blog Posts

Next: Creating Your PI Backlog Content

Creating Your PI Backlog Content – Agility Planning

Glenn Smith and Darren Wilmshurst with Radtac, a Scaled Agile Partner, co-wrote this blog post. 

At the conclusion of Program Increment (PI) Planning, we’re always reminded of something one of our colleagues always says. There’s much to celebrate because we’ve created a set of committed plans. But we first have to complete a retrospective of the PI Planning event (cue groans from everyone in the room) and we “start preparing tomorrow” for the next PI (more groans).

Moreover, the critical path for any PI Planning is the creation of the content, suitably refined and prioritized. Without this, we can’t do any planning! But what does this look like in practice? 

This blog post is aimed at coaches who need to think about the content preparation for the next PI. By that we mean SAFe® Program Consultants (SPCs) supporting the Agile Release Train (ART) and Release Train Engineers (RTEs). But more importantly, Product Management (PM) and System Architects (SA) need to create, refine, prioritize, and socialize the content supported by Product Owners (POs) and Business Owners (BOs). We will explore each of these roles in turn during the course of this post. 

The traditional siloed hierarchy of organizations can engender a ‘this isn’t my job’ attitude. Yet many people and roles need to work together to create a compelling backlog that delivers economic benefits and satisfies your customers.

The visual model below is a high-level view of the intensity of the preparation activity for each of these roles. It isn’t meant to represent the number of hours. That is, high intensity does not mean 100 percent of your time, we just expect more time spent on preparation while recognizing that there will be other things to be done.

PI Backlog Content
Preparation intensity for specific roles.

You will also notice that there is a significant spike in preparation during the Innovation and Planning (IP) Sprint for PM, BOs, POs, and the Teams. This is when PI Planning happens.

Product Management and System Architect

PM and the SA will follow a similar pattern to each other, as their roles are two sides of the same coin—one focused on the outward market and the other technically oriented. They are going to be collaborating and working closely to make sure their respected needs are met and the right balance of the work is correctly scheduled.

Crafting backlog items for an ART, whether they are Business Features or Enabler Features, follow a pattern of Creating, Refining, Prioritising, and Socialising. While overly simplistic, each step could follow the first four iterations of a PI. In the first half of the PI, expect PM and the SA to be looking to the future. This will include looking at upcoming Epics, decomposing existing Epics, and the ART roadmap and associated Architecture Runway.

A common pattern is to see poorly defined Features with weak benefit hypothesis statements and acceptance criteria. It shouldn’t be overlooked how much effort this takes to do well. This is because the work involved isn’t just writing them down in your Agile Lifecycle Management tooling, but working with BOs, talking to a wider stakeholder cohort, including customers, and reviewing market trends. Improving their own understanding of the value proposition and scope enables people on the ART to more easily deliver against it. Through the PI, their effort tapers as other cohorts take the backlog content and prepare for PI Planning.

Business Owners

BOs are key stakeholders and critical friends of the ART. As such, they gradually experience an increasing demand on their time to support creating backlog content throughout the PI—with the most involvement happening during PI Planning. As a cohort, BOs are available when needed by the likes of PM, and actively participate in the System Demos every iteration. Here, they not only get to see the progress of delivery but give feedback to help PM and the POs inspect and adapt the backlog.

We recommend that prioritization be a ‘little and often’ affair. And as it is a team sport, BOs must attend these sessions (these are the little spikes on the BO line in the model).

Product Owners

In a scaled environment, POs serve both the team and the train. In the initial periods of the PI, as you might expect, the PO has both a team execution focus and needs to support PM with Feature creation and refinement. As the content starts to get in better shape for the upcoming PI Planning, PO involvement increases, but with a shift in focus to Feature elaboration and decomposition into drafting user stories to later socialize with the team.

The Team

Through most of the PI, the team is execution-focused, although on hand for those ad hoc, short whiteboard sessions with PM, SAs, and POs. Larger demands on the team’s time should be scheduled like any other demand on their time—after all, work is work! This will be done through the use of exploration enablers in a future PI, or spikes and innovation activities that occur during the IP iteration. Either way, the outcome is gaining knowledge that reduces the uncertainty of future work.

The team’s involvement, however, peaks during the IP iteration when the POs socialize the upcoming backlog of work—the Features and the draft stories they have created. It is during the preparation for PI Planning that the team takes time to understand what is needed and answer questions that need “I’ll look in the code” to find out.

Release Train Engineer and Scrum Master

Hey wait, you didn’t forget about the RTE and Scrum Master (SM), did you? Surely they are just facilitators, we hear you say, what do they have to do with backlog items? But let’s think about this. As facilitators at the train or team level, they are key advocates for the improvement of flow and value delivery. Therefore, it is not unreasonable to expect them to create improvement items that require effort from the teams during the PI. And we know that anything that requires effort from the teams should be planned accordingly.

The items that the RTE and SM will bring to the table for inclusion will likely come from team retrospectives, the Inspect and Adapt problem-solving workshop, or from insight gained from activities like the SAFe® DevOps course.

Creating Content During PI Planning

During each PI Planning session, PM presents the vision, which highlights the proposed features of the solution, along with any relevant upcoming Milestones. While some may feel that at this point in the proceedings the content creation is over for PM, there is actually still work to do. During the planning, there will likely be scope negotiations and prioritization calls needed as the teams get deeper into understanding and scheduling in their breakout sessions.

Similarly, the BOs have a role in adaptive content creation too. Beyond providing the business context in the briefings, they will work with the team to discuss the needed outcomes from the work. And they’ll support PM and the SAs in adapting the scope from what was originally crafted—because tradeoffs need to be made during planning. Discussions with the teams during the assignment of Business Value could influence what gets produced in the upcoming PI too.

While the POs and the Teams need to sequence and plan their stories to maximize economic results, there will almost certainly be variability of scope that will need to be accommodated as new information emerges. This will involve further elaboration, negotiation, planning, and reworking of the content during PI Planning.

In addition, the model shouldn’t be followed religiously, but used to identify who, when, and by how much focus the different roles on the train need to spend to make this happen. While putting an emphasis on the quality of the backlog items is going to help your ART, it alone won’t fix your delivery problems but will act as a key enabler in doing so. 

It is important to give a government health warning at this stage: context is king! While we have given our view on the preparation activities and the intensity, your context will provide a different reflection. In fact, when creating this post, we both had a slightly different approach for prioritization based on our respective experiences. Neither is right or wrong but a reflection on the clients that we have worked with. So please treat the model we have created as a ‘mental model’ and something you can use with your trains to frame a discussion. 

The pattern, while broadly accurate, will change in some situations, particularly if you are preparing for a training launch and this is your first PI. Here, the cadence may be condensed and more focused, but this will be guided by the quality of the backlog content you already have.

A final thought and back to our colleague who says that “PI Planning starts tomorrow.” So does PI Execution. There’s no point in making a team committed to the plans that you have created and then not executing on them. Otherwise, what was the point of PI Planning in the first place?

If we’ve piqued your interest, check out this post about changing a feature in the middle of the PI. It’s a question we always get asked when we teach the Implementing SAFe® class.

About Glenn

Glenn Smith is SAFe program Consultant Trainer (SPCT)

Glenn Smith is SAFe Program Consultant Trainer (SPCT), SPC, and RTE working for Radtac as a consultant and trainer out of the UK. He is a techie at heart, now with a people and process focus supporting organizations globally to improve how they operate in a Lean-Agile way. You will find him regularly talking at conferences and writing about his experiences to share his knowledge.

Share:

Back to: All Blog Posts

Next: We’re Giving More Than a Donation for Pride Month

Three Steps to Prepare for a Successful Value Stream Workshop – SAFe Transformation

Value Stream Workshop

The Value Stream and Agile Release Train (ART) identification workshop are some of the most critical steps to generate meaningful results from your SAFe transformation. That’s because it enables you to respond faster to customer needs by organizing around value. This workshop can also be the hardest step. It’s complex and politically charged, so organizations often skip or mismanage it.

A savvy change agent would invest in the organizational and cultural readiness to improve the chances of its success. Attempting to shortcut or breeze through change readiness would be the same as putting your foot on the brake at the same time you’re trying to accelerate. Get this workshop right, and you’ll be well on your way to a successful SAFe implementation.

Why Is It So Difficult? 

Aside from the complex mechanics of identifying your value streams, there is also a people component that adds to the challenge. Leaders are often misaligned about the implications of the workshop, and it can be tough to get the right participants to attend.  For example, a people leader could soon realize that ARTs may be organized in a way that crosses multiple reporting relationships, raising the concern of their direct reports joining ARTs that don’t report to them. 

In reflecting on my battle scars from the field, I’ve distilled my advice to three steps to prepare the organization for a successful workshop.

Step 1: Engage the right participants

The Value Stream and ART identification workshop can only be effective and valuable if the right audience is present and engaged. This is the first step to ensure the outcome of the workshop solves for the whole system and breaks through organizational silos.

“… and If you can’t come, send no one.” —W. Edwards Deming

The required attendees will fall into four broad categories:

  • Executives and leaders with the authority required to form ARTs that cut across silos.
  • Business owners and stakeholders who can speak to the operational activities of the business, including ones with security and compliance concerns.
  • Technical design authorities and development managers who can identify impacted systems and are responsible for the people who are working on them.
  • Lean-Agile Center of Excellence and change agents supporting the SAFe implementation and facilitating the workshop.

Use some guiding questions to identify the right audience for the workshop within your organization. Are the participants empowered to make organizational decisions? Do the participants represent the whole value stream? Is the number of attendees within a reasonable range to make effective decisions?

Step 2: Build leadership support and pre-align expectations

To support engagement and address potential resistance, I recommend performing a series of interactions with leaders in advance of the workshop. In such interactions, the change agent would socialize a crisp and compelling case for change in the organization, supporting the “why” behind running the workshop.

The change agent needs to be prepared to address leader trepidation about the possibility of having their reporting-line personnel on ARTs that they don’t fully own.  Most compelling is a data-based case made by performing value-stream mapping with real project data to expose the delays in value delivery due to organizational handoffs. 

Interaction opportunities can include one-on-one empathy interviews, attending staff meetings, internal focus groups, and overview sessions open to all workshop participants. 

I highly advise setting expectations with leaders in advance of the workshop. This will help them understand the workshop implications, help identify potential misalignment or resistance, and coach them in how to signal support for the workshop purpose.  

The following are useful expectations to set with the participants in advance to help shape how they view the upcoming workshop:

Value Stream Workshop
  • Allow the designs to emerge during the session. This is meant as a collaborative workshop.
  • Expect to be active and on your feet during the session, actively contributing to the designs.
  • Be present and free up your schedule for the duration of the workshop as key organizational decisions are being made.
  • Alleviate the anxiety of broad, big-bang change by clarifying that they get to influence the implementation plan and timing to launch the ARTs.
  • Address the misconception about organizational change by explaining that ARTs are “virtual” organizations, and that reporting lines need not be disrupted.

Step 3: Prepare the workshop facilitators

A successful Value Stream and ART identification workshop will have the main facilitator, ideally someone with experience running this workshop. Additionally, you’ll need a facilitator, typically an SPC, per every group of six to eight attendees. Prior to the workshop date, schedule several facilitator meetings to prepare and align them on the game plan. This will go a long way in helping your facilitators project competence and confidence during the workshop. Discuss the inherent challenges and potential resistance, and how the facilitators can best facilitate such moments. Share insights on change readiness based on the leadership interactions and empathy interviews. Finally, prepare a shared communication backchannel for facilitators, and build in sync points during the event to ensure alignment across the groups.

While these simple steps and readiness recommendations don’t necessarily guarantee a successful workshop, they’re a great starting point. You’ll still need to understand the mechanics of identifying value streams. This is what Adam will cover in the next post in our value stream series. Look for it next week.

In the meantime, check out the new Organize Around Value page on the SAFe Community Platform.

About Deema Dajani

Deema Dajani is a Certified SAFe® Program Consultant Trainer (SPCT).

Deema Dajani is a Certified SAFe® Program Consultant Trainer (SPCT).
Drawing on her successful startup background and an MBA from Kellogg Northwestern University, Deema helps large enterprises thrive through successful Agile transformations. Deema is passionate about organizing Agile communities for good, and helped co-found the Women in Agile nonprofit. She’s also a frequent speaker at Agile conferences and most recently contributed to a book on business agility.

View all posts by Deema Dajani

Share:

Back to: All Blog Posts

Next: Leading the SAFe® Conversation to Win Over Your Peers

Aligning Global Teams Through Agile Program Management: A Case Study – Agile Transformation

Agile Program Management

Like many organizations, Planview operates globally, with headquarters in Austin, Texas, and offices in Stockholm and Bangalore. About two years ago, we launched a company-wide initiative to rewire our organization and embrace Agile ways of working—not just in product and R&D, but across every department and team, starting with marketing. We developed three go-to-market (GTM) teams, whose goals and objectives centered around building marketing campaigns to create a pipeline for sales. Each team aligned to a different buyer group, with members from the product, marketing, and sales.

The challenge: integrating international teams in our Agile transformation

Like many organizations, we struggled to align and execute our marketing programs across our international teams, defaulting to “North-America-first efforts” that other regions were then left to replicate. As we built out these new groups, we considered how to best include our five-person team of regionally aligned field and demand marketers in Europe, the Middle East, and Africa (EMEA).

At the beginning of our Agile transformation, the EMEA marketers were often misaligned and disconnected from big-picture plans. The EMEA teams were running different campaigns from those in North America. Before forming cross-functional GTM teams, the EMEA team had to individually meet with the different functions in marketing, product marketing, and other departments. The extra complications of time zones and cultures also made it difficult to get things done and stay on strategy.

With team members feeling disconnected, at Planview we suffered lower-impact campaigns and less-than-ideal demand generation. To succeed in our Agile transformation journey, it was critical to properly align the international team through an integrated Agile program management strategy.

The approach: forming and integrating the EMEA team into Agile program management

While the three GTM teams had dedicated cross-functional members representing demand generation, content strategy, and product marketing, it was clear that assigning an EMEA team member to each of these teams wouldn’t solve the problem. Each EMEA marketer is organized by region and language, not by GTM Agile Release Train (ART), so we needed to develop our own EMEA Agile program that would meet the challenges and achieve the needed international alignment.

Agile Program Management

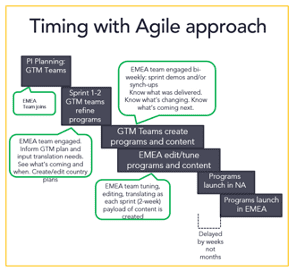
Working with our Chief Marketing Officer and other stakeholders, we determined that we would continue to align our EMEA team by region/language. Now that the GTM teams were formed (with each team having all the necessary people to deliver end-to-end value), the EMEA team could meet with each team in the context of the prioritized strategic initiatives. Drawing on our local expertise, we could weigh the campaigns from the three GTM teams against each other to determine which would drive the most pipeline and impact in each region. This structure enabled EMEA marketers to opt into GTM campaigns that were regionally impactful, instead of creating standalone campaigns. This approach has been a success. At our last PI planning event, EMEA progressed from just replicating campaigns into co-planning and co-creating the campaigns that were of local interest and fit.

By including the distributed teams in Agile program management, we achieved better alignment as a global marketing team; gave our EMEA marketers the opportunity to leverage fully supported, regionally impactful campaigns; and ultimately, achieved better results for our demand generation campaigns.

Learning 1: When starting the process of shifting to an Agile approach, there is an advantage in letting the GTM team form, storm, and norm before involving the EMEA team. That delay allows for the EMEA team to finish up previously committed (sales-agreed-upon) deliverables. It gives the team and the sales stakeholders time to observe and see the benefits of Agile GTM teams without feeling that they are not getting the support they were expecting.

The practice: virtual, inclusive PI planning

Our model continues to evolve in a positive way. We’ve now been through five PI planning events and have transitioned from a “one EMEA representative” approach to including our full marketing team in a truly global planning event.

What does a global planning event look like in practice?

When our EMEA team started to participate in PI planning, we had one representative join to understand the process and feed the critical milestones into the team’s plans. We then matured to the full team joining remotely, which meant that we needed to create a system that would enable inclusive planning across continents.

We created a process of “continuous planning.” First, our global team would plan “together,” from Austin and virtually via web conferencing for EMEA. Our EMEA teams would log off during the evenings in their time zones, and the US team would continue to plan with recorded readouts. The next morning, while the US teams were offline, the EMEA teams would listen to the readouts, adapt plans accordingly, and provide their own readouts on changes made once the team was back together during mutual business hours. While tricky at first, this process ensured that everyone was engaged and that all teams’ contributions were heard and considered. Most recently, we’ve conducted fully virtual planning in mutual time zones.

Learning 2: The gradual inclusion in PI planning meant the GTM teams were already well-established and well-versed in the process. The maturity of the teams and the process helped a lot in the inclusion of the international team.

The results: greater alignment, faster time-to-market, better campaigns

Agile Program Management

The impact of our EMEA Agile program can be broken down into three main categories: alignment, time, and utilization.

The collaboration between the EMEA and GTM teams has created significantly stronger connection and alignment, evidenced by both the improvement in campaign quality and our working practices. Our teams have increased visibility into shared and separate work and developed a better understanding of how decisions impact overarching shared goals.

Our Agile ceremonies, combined with the use of Planview LeanKit, have served as a catalyst and a framework to bring us closer together. Communication is easier, more frequent, and more productive, as everyone is aligned to the same goals and plans and has visibility into each other’s progress, needs, and capacity. The greater team can now make conscious trade-offs based on mutual priorities, which enables the EMEA team to focus on the right things and deemphasize asks that are not aligned to the goals. EMEA marketers feel more involved and have an important seat at the table. That is both motivating and effective.

Learning 3: Ceremonies and visual planning tools are absolutely necessary, but only really benefit teams with the right enablement and coaching. To this day we still meet weekly with our Agile coach to refine our LeanKit board and discuss WIP limits, sizing, retros, etc.

From a time-to-market perspective, we’ve seen substantial improvements. Before aligning EMEA to the GTM teams, there were delays in deploying campaigns because EMEA would “find out” about campaigns rather than being part of them from the beginning. Now, the team can give early input and feedback on how a campaign could be adapted to provide the most impact for EMEA, then roll it out more quickly. As a concrete example, we have reduced the time for campaign tactics to go live from three months to three weeks.

The volume and quality of campaigns and campaign materials has increased significantly as well. In the past, the EMEA team often made do with the materials (especially translated materials) that were available, not the assets that were ideal. There were campaign ideas that we could not realize due to a lack of localized material. Without dedicated resources for EMEA, the team had to share creative and translation services with North American providers, who often needed to prioritize programs led by corporate/North America.

Now that EMEA has full visibility into the North American programs, they know what kind of material is in development.

Scaled Agile

They give input on what is needed to execute campaigns in global markets and when delivery will happen. That means EMEA campaigns can begin at almost the same time as the North American ones, and their marketers can prepare for when translated assets and other materials will be available.

Overall, by transforming our EMEA Agile program, the region went from running one or two campaigns each PI to running five campaigns per PI. EMEA marketing went from approximately four to six new localized assets/materials per year to 18 – 20. We added three translated, campaign-specific landing pages per language. And, most importantly, we’re beginning to see direct indication of pipeline improvements.

Agile program management can be challenging with international, distributed teams. By integrating our global team members into our planning processes from the beginning of our Agile transformation, we’ve been able to achieve measurable benefits across the marketing organization.

About Verena Bergfors

Verena is the Marketing Director for Planview’s EMEA markets

Verena is the Marketing Director for Planview’s EMEA markets. She’s from Germany but moved to Sweden around 10 years ago and has been with Planview for over four years. Prior to living in Sweden, she worked in Shanghai for seven years where she held positions in marketing and sales. Verena’s true passion is languages and she enjoys working on diverse international teams.

View all posts by Verena Bergfors

Share:

Back to: All Blog Posts

Next: Use WSJF to Inspire a Successful SAFe Adoption

Use WSJF to Inspire a Successful SAFe® Adoption – Agile for Business

SAFe® Adoption

By definition, Weighted Shortest Job First (WSJF) is a prioritization model used to sequence jobs to produce maximum economic benefit. Utilizing WSJF relies on the Cost of Delay and job size to determine its weight in priority. Think of the Cost of Delay as the price you pay for not delivering a feature to the end-user in a timely manner. For instance, if you know a competitor is also working on a similar initiative to yours, you can acknowledge the risk of losing customers if the experience you deliver pales in comparison.

I like to refer to WSJF as a tool that helps you take the emotion and politics out of a decision and rely on facts instead. WSJF allows us to take an economic view and not be swayed by the loudest complainer (aka squeaky wheel) or the person with the longest title in the room.

I’m sure we can all relate to being in a prioritization meeting either before, during, or after your SAFe® adoption where people demand that their feature be the top priority. But what they can’t clearly explain is why they want it, why that feature is important to the business, end-user, or buyer, and how it aligns with the organization’s purpose. After the WSJF exercise, participants often assume that the biggest, most needed items will find their way to the top of the priority list and are surprised by what features actually get selected. Remember, in Agile, we like to show value quickly. So, WSJF also helps participants identify features that could be too large to ever get to the top, forcing them to break down the work into more manageable batches.

Here’s an example from a retail company I worked with. The company’s top priority at the time was a single-sign-on (SSO) integration feature that was considered critical to improving the user experience. SSO was all everyone was talking about. So, after going through the WSJF exercise, a marketing executive was surprised that aspects of their SSO integration weren’t at the top of the list. The conversation surrounding this—which, by the way, involved the squeaky wheel and the person with the longest tile—enabled participants to break the work down into smaller batches. Everyone involved in the discussion got the context they needed to see that by changing the scope of the work, teams could provide incremental value to customers more quickly. We then went back through the WSJF exercise with the smaller batches of work, some of which moved to the top of the priority list and others moved further down.

Going through this exercise gave participants the context and information to explain:

  • Why and when items were being delivered
  • How customers would be delighted with ongoing improvements versus one large release in the future

Having those key stakeholders in the room allowed us to work through the tough conversations and gain alignment more quickly. That’s not to say the conversations were any easier. But showing how the larger batches of work could be broken down into small batches provided proper context based on end-user value and faster delivery.

In the end, WSJF doesn’t only help an organization deliver the most value in the shortest amount of time, it also fosters decentralized decision-making. This requires your RTE or Product Managers to be steadfast in their approach to ensure trust and belief in the process. When members of the team see leadership supporting this new approach, even when that leader’s feature doesn’t land at the top, it goes a long way in building the trust and culture to inspire a successful SAFe adoption.

About Elizabeth Wilson

Elizabeth Wilson

For more than a decade, Elizabeth has successfully led technology projects, and her recent experiences have focused on connected products. As an SPC, she’s highly versed in Agile methodology practices, including SAFe, and leverages that expertise to help companies gain more visibility, achieve faster development cycles, and improve predictability. With a wealth of practical, hands-on experience, Elizabeth brings a unique perspective and contextual stories to guide organizations through their Agile journey.

View all posts by Elizabeth Wilson

Share:

Back to: All Blog Posts

Next: The SAFe Coach

Agility Fuel – Powering Agile Teams

Agility Fuel

One of my favorite analogies for agile teams is to compare them to an F-1 race car. These race cars are the result of some of the most precise, high-performance engineering on the planet, and they have quite a bit in common with high-functioning agile teams. Much like F-1 cars, agile teams require the best people, practices, and support that you can deliver in order to get the best performance out of them.

And just like supercar racing machines, agile teams need fuel in order to run. That fuel is what this post is about. In the agile world, the fuel of choice is feedback. I would like to introduce a new ‘lens’ or way of looking at feedback. I’ll leverage some learning from the art of systems thinking to provide a better understanding of what various metrics are and how they impact our systems every day.

Most often, this feedback is directly from the customer, but there are other types as well. We have feedback regarding our processes and feedback from our machinery itself. In broad terms, the feedback in an agile world falls into three different categories:

  1. Process: Feedback on how the team is performing its agility.
  2. DevOps: This is feedback on the machinery of our development efforts.
  3. Product: The so-called ‘Gemba metrics.’ This segment of feedback is where we learn from actual customer interaction with our product.

Thinking in Feedback

Every agile framework embraces systems thinking as a core principle. In this exercise, we are going to use systems thinking to change how we see, interact with, and make predictions from our feedback. If you want to go deeper into systems, please pick up “Thinking in Systems,” by Donella Meadows or “The Fifth Discipline,” by Peter Senge. Either one of these books is a great introduction to systems thinking, but the first one focuses solely on this topic.

For the purposes of this post, we will be thinking about our feedback in the following format:

Metric

This is the actual metric, or feedback, that we are going to be collecting and monitoring.

Category

Every feedback loop will be a process-, operational-, or product-focused loop.

Stock

Each feedback metric will be impacting some stock within your organization. In each case, we will be talking about how the stock and the feedback are connected to each other.

Type

Balancing: Think of the thermostat in a room; it drives the temperature of the room (the stock) to a specific range and then holds it there. These are balancing feedback loops.

Reinforcing: Because a savings account interest is based on how much is in the account, whenever you add that interest back in, there is more stock (amount in the account) and more interest will be deposited next time. This is a reinforcing feedback loop.

Delay

Feedback always reports on what has already happened. We must understand the minimum delay that each system has built into it, otherwise system behavior will oscillate as we react to the way things used to be.

Limits

We will talk about the limits for each stock/feedback pair so that you can understand them, and know when a system is operating correctly, but has just hit a limit.

A Few Examples

Let’s look at one example metric from each category so that you can see how to look at metrics with this lens.

ART Velocity

Agility Fuel

Discussion:

ART velocity impacts two stocks: Program Backlog and Features Shipped, both of which are metrics themselves. In both cases, ART Velocity is a balancing loop since it is attempting to drive those metrics in particular directions. It drives Program Backlog to zero and Features Shipped steadily upward. In neither case will the stock add back into itself like an interest-bearing savings account.

The upper limit is the release train’s sustainability. So, things like DevOps culture, work-life balance, employee satisfaction, and other such concerns will all come into play in dictating the upper limit of how fast your release train can possibly go. The lower limit here is zero, but of course, coaches and leadership will intervene before that happens.

Percent Unit Test Coverage

Agility Fuel

Discussion:

Percent Unit Test Coverage is a simple metric that encapsulates the likelihood of your deployments going smoothly. The closer this metric is to 100 percent, the less troublesome your product deployments will be. The interesting point here is that the delay is strictly limited by your developers’ integration frequency, or how often they check in code. Your release train can improve the cadence of the metric by simply architecting for a faster check-in cadence.

Top Exit Pages

Agility Fuel

Discussion:

This list of pages will illuminate which ones are the last pages your customers see before going elsewhere. This is very enlightening because any page other than proper logouts, or thank-you-for-your-purchase pages, is possibly problematic. Product teams should be constantly aware of top exit pages that exist anywhere within the customer journey before the value is delivered.

This metric directly impacts your product backlog but is less concerned with how much of anything is in that backlog and more of what is in there. This metric should be initiating conversations about how to remedy any potential problem that the Top Exit pages might be a symptom of.

Caution

Yes, agility fuel is in fact metrics. Actual, meaningful metrics about how things are running in your development shop. But here is the thing about metrics … I have never met a metric that I could not beat, and your developers are no different. So, how do we embrace metrics as a control measure without the agile teams working the metric to optimize their reward at the cost of effective delivery?

The answer is simple: values. In order for anything in this blog post to work, you need to be building a culture that takes care of its people, corrects errors without punitive punishment, and where trust is pervasive in all human interactions. If the leadership cannot trust the team or the team cannot trust its leadership, then these metrics can do much more harm than good. Please proceed with this cautionary note in mind.

Conclusion

This blog post has been a quick intro to a new way of looking at metrics: as agility fuel. In order to make sense of how your high-performance machine is operating you must understand the feedback loops and stocks that those loops impact. If this work interests you, please pay attention to our deep-dive blog posts over on AllisonAgile.com. Soon, we’ll be posting much more in-depth analysis of metrics and how they impact decisions that agile leaders must make.

About Allison Agile

Lee Allison is a SAFe 5.0 Program Consultant

Lee Allison is a SAFe 5.0 Program Consultant who implements Scaled Agile across the country. He fell in love with Agile over a decade ago when he saw how positively it can impact people’s work lives. He is the CEO of Allison Agile, LLC, which is central and south Texas’ original Scaled Agile Partner.

View all posts by Allison Agile

Share:

Back to: All Blog Posts

Next: Tips to Pass Your SAFe Exam and Get Certified

How to Pass a SAFe Exam and Get Certified

SAFe Exam and Get Certified

I’ve always been a good test-taker. I also spent almost two years teaching students how to raise their scores on standardized tests like the ACT, SAT, PSAT, and HSPT. 

I relied on this previous experience when I studied for and took my SAFe® exam, and it worked. I passed. 

I’m sharing the following study and test-taking guidelines to help you pass your SAFe exam:

  1. Understand the SAFe exam format
  2. Study for the SAFe exam by interacting with the content in multiple ways
  3. Take the SAFe exam in prime condition

Learn more about each tip in the following sections.

Tip One | Understand the SAFe® Exam Format

Before you can begin studying, you should understand the test format and structure. Important things to know about your exam include

  • Exam style
  • Number of questions
  • How much time you have to complete the whole exam
  • Average time per question
  • Passing score
  • Exam rules

SAFe® exam question types

Example of a multiple choice question
Example of a multiple choice exam question

All of our SAFe 6.0 exams are multiple choice (one answer). However, the number of questions and time you have to complete your exam vary. 

Here are some tips for tackling these types of questions:

  • Look for clue words and numbers: Opposite answers usually signal one is correct, absolutes (always, never, every time) are usually incorrect whereas non-absolutes (sometimes, often, seldom) are usually correct, and the verbs and tenses of the correct answers will agree with the subjects and tenses used in the question. 
  • If the answer is only partly true, it’s probably incorrect: Don’t convince yourself an answer is true if it isn’t. We don’t put trick questions in our exams, so unless the answer is obviously true, it’s probably incorrect. 
  • Make predictions: After you’ve read the question, guess what the answer is before reading the choices. If one of them is the same as the answer you came up with, it’s probably the correct one.
  • Review phrases: If answers repeat exactly what was stated in the question, they’re usually incorrect. Additionally, scientific words are usually correct over slang words. 
  • If you get stuck on a question: Skip it and come back. Other questions and answers may jog your memory. Our exam platform, QuestionMark, makes skipping questions easy because you can flag questions to come back to at a later point during the exam.   

To see your specific SAFe exam details, visit the certification exams page in SAFe® Studio.

Tip Two | Interact with the SAFe Exam Content in Multiple Ways

The first way to learn exam content is by participating in your SAFe course. Once you’ve learned the content, here are a few ways to remember it.

Course digital workbook for Leading SAFe®

Step One: Study SAFe® materials

The My Learning section in SAFe® Studio is the best place to start when studying for your exam. When you log in, you’ll see materials for each course you’ve taken. These materials include

  • The course digital workbook
  • The SAFe exam study guide
  • The practice test

Review the course slides and your notes after the class. Then download the SAFe exam study guide provided and read through it.

Example of a SAFe exam study guide

The exam study guide is a great tool for determining what percentage of the exam will be made up of a specific domain and the topics within it. These topics will also show in the feedback reports for both the practice test and exam.

You can also learn from others’ experiences in the SAFe Community Forums. When in doubt about which forum to start with, use the general SAFe discussion group. Someone will guide you to the appropriate forum from there.

Additionally, there are plenty of SAFe videos that break large Framework concepts into smaller, visual pieces that can be easier to study if you’re a visual learner. 

When all else fails, ask a peer who has already passed their exam which materials they found most helpful when studying.

Step Two: Target your weaknesses by taking a practice test

To make the best use of your time, you need to target not only your perceived weaknesses but your objective weaknesses. One of the best ways to do this is by taking the practice test in the same conditions in which you’ll take the certification exam. 

In SAFe practice tests, you can see which questions you got wrong but not the correct answers. You can also see a category breakdown and the percentage you got right in each. This breakdown gives you specific topics to focus on when studying.

A screenshot of practice test results
A screenshot showing how the practice test displays the breakdown of each category and the percent you got correct
 How the practice test displays the breakdown of each category and the percent you got correct

I recommend using the practice test to guide your studying. Take it after you’ve finished the class before you’ve begun studying earnestly. Then prioritize studying the categories in which you received the lowest scores. 

A word of caution: do not try to memorize the practice test. The questions on the actual exam aren’t the same. 
Focus instead on the concepts. Ensure you’ve clarified all the terms and content you felt shaky on in the practice test.

Step Three: Engage creatively with the content

Now you need to try to learn the material you’re weakest in; reading the articles over and over isn’t going to cut it. These were my favorite ways to engage creatively with the content and study.

Teach the material to someone unfamiliar with it

Explain the Big Picture to someone. If you’re familiar with all of the icons on the Big Picture and can explain them well, you’re in good shape.

Bonus points if it’s someone not familiar with the Big Picture or SAFe. They’ll have many questions to test your knowledge further.

Build a case study

Use a real company, your company, or a fictitious company and try to apply some of the abstract concepts with which you’re struggling. 

While studying for the SPC exam, I created a fake company called Lib’s Lemonade. I outlined its strategic themes and objectives and key results (OKRs). I then made a Lean business case for a proposed product. Finally, I attempted to map the company’s value streams. 

Bonus points if you share it with someone else who is knowledgeable in SAFe and who can check for correctness.

Review your work through a SAFe lens

What matches the Framework? What doesn’t? Does your team write stories using user-story voice? Do you use the IP iteration for innovation and planning? Does your team have WIP limits on its Kanban board? Do you have a scrum master? What would it be like if your company did things differently? 

Have a conversation with a coworker about these discrepancies. If you have some influence, make some of these changes. Or shadow and learn from someone in your company who works in the same role for which you took the course.

Have someone quiz you on high-level topics

Make flashcards with questions on the front and the answers on the back. Then ask a friend to quiz you with the cards with the question side facing you and the answer side facing them. This method lets you simultaneously see the question while they check the answer on the back.

Find a study partner

If you know someone who took the class with you and is also studying for the exam, meet up to study with them. Ask each other questions, hold each other accountable, and wish each other luck when you take the exam. 

Preparing for an exam with a partner makes it more approachable and can make the experience more fun and comfortable.

Take the SAFe Exam

SAFe Exam and Get Certified

The only thing left is to take the exam. If you’re like me, it’s probably been a while since you last took an exam. 

Here are some of my favorite test-taking tips to help dust off the cobwebs.

Don’t wait until the last minute

You have 30 days after you’ve completed your course to take your exam. Don’t wait until the last two hours of this deadline; it will only increase the pressure. Take the exam when you have the appropriate time, space, internet connection, and quiet to focus.

Track the time

The countdown clock at the top of the screen will help you keep track of the time. Use this to pace yourself throughout the exam.

Read each question carefully

You can also read them aloud to ensure you slow yourself down and reduce your chances of misreading the question. Once you’ve read the question, don’t forget to read all the answer choices, even if you think you know the answer before you’ve read them all. There may be a more correct answer waiting for you to select it.

Review your answers before submitting

Make sure each answer you chose actually answers the question. Also, only change your answer when you know with certainty that your previous answer was a mistake. Changing your answer based on a whim is a bad idea.

Use process of elimination

Sometimes, when you read the question, you won’t be sure what the correct answer is. But chances are you’ll know that some answers are incorrect. Eliminate them, and don’t look at them again. This technique will free up your working memory to focus on the final two or three options remaining.

Prime your mind

The power of association is strong. And according to this article, the sense of smell most strongly recalls memory. 

So, if you chew mint gum while studying for your SAFe exam at the desk in your home office at night, research shows that you’ll prime yourself to do well on the exam if you chew mint gum while taking your SAFe exam at the desk in your home office at night. 

Some people use a scented perfume, lotion, or lip balm to elicit the same effect. And as long as you were in a good headspace while studying, you’ll likely be in a good headspace while taking the exam.

Calm your nerves

Many people have test anxiety. Knowing what to expect for the exam can help decrease this anxiety significantly. 

Confidence from studying the content can also ease your nerves. Going into the exam well-prepared always helps. 

If worse comes to worst, and you don’t pass the exam on the first try, knowing that you can take the exam again and pass can also be a comforting feeling.

Conclusion

Here are some additional resources to help you with studying for and passing the exam:

Please note that we highly discourage visiting websites that claim to have real SAFe exams or answers. Test material changes often, and it’s a violation of our ethics and certification standards to use these resources.

There you have it: the keys to passing a SAFe exam to get certified. And after you pass your exam, don’t forget to claim your well-earned certification badge. Here’s how.

Now it’s time to begin your exam. Good luck from the Scaled Agile, Inc. team! You’ve got this.

Take your exam. You've got this!

Log in Now

About Emma Ropski

Emma Ropski scrum master and SAFe Program Consultant

Emma is a Certified SPC and scrum master at Scaled Agile, Inc. As a lifelong learner and teacher, she loves to illustrate, clarify, and simplify to keep all teammates and SAFe learners engaged. Connect with Emma on LinkedIn.

View all posts by Emma Ropski

Share:

Back to: All Blog Posts

Next: Avoid Change Saturation to Land Change Well