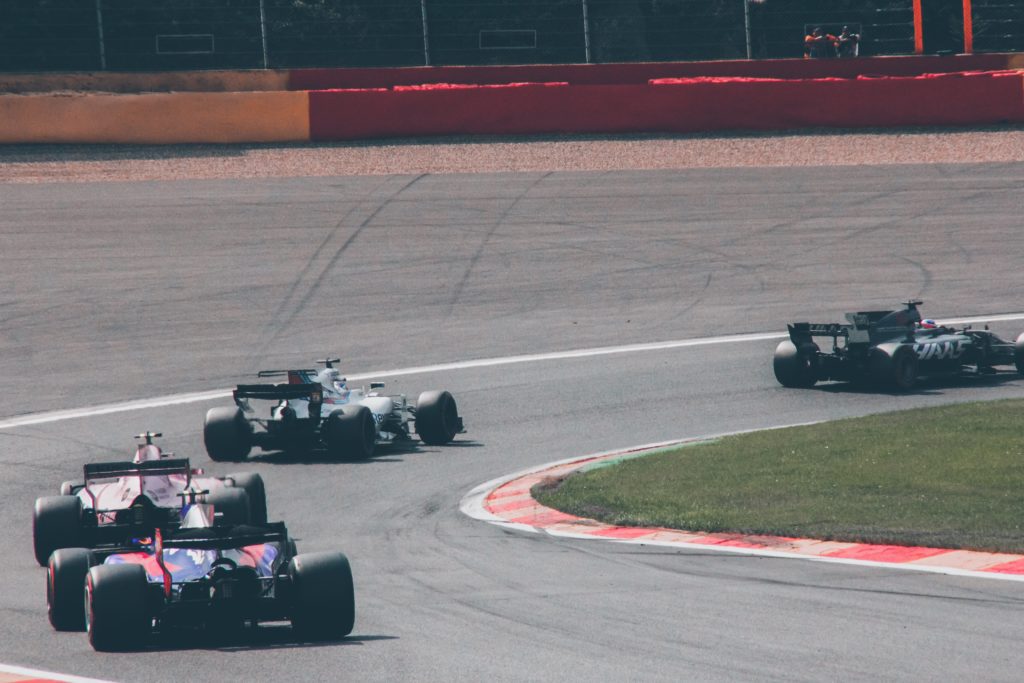
One of my favorite analogies for agile teams is to compare them to an F-1 race car. These race cars are the result of some of the most precise, high-performance engineering on the planet, and they have quite a bit in common with high-functioning agile teams. Much like F-1 cars, agile teams require the best people, practices, and support that you can deliver in order to get the best performance out of them.
And just like supercar racing machines, agile teams need fuel in order to run. That fuel is what this post is about. In the agile world, the fuel of choice is feedback. I would like to introduce a new ‘lens’ or way of looking at feedback. I’ll leverage some learning from the art of systems thinking to provide a better understanding of what various metrics are and how they impact our systems every day.
Most often, this feedback is directly from the customer, but there are other types as well. We have feedback regarding our processes and feedback from our machinery itself. In broad terms, the feedback in an agile world falls into three different categories:
- Process: Feedback on how the team is performing its agility.
- DevOps: This is feedback on the machinery of our development efforts.
- Product: The so-called ‘Gemba metrics.’ This segment of feedback is where we learn from actual customer interaction with our product.
Thinking in Feedback
Every agile framework embraces systems thinking as a core principle. In this exercise, we are going to use systems thinking to change how we see, interact with, and make predictions from our feedback. If you want to go deeper into systems, please pick up “Thinking in Systems,” by Donella Meadows or “The Fifth Discipline,” by Peter Senge. Either one of these books is a great introduction to systems thinking, but the first one focuses solely on this topic.
For the purposes of this post, we will be thinking about our feedback in the following format:
Metric
This is the actual metric, or feedback, that we are going to be collecting and monitoring.
Category
Every feedback loop will be a process-, operational-, or product-focused loop.
Stock
Each feedback metric will be impacting some stock within your organization. In each case, we will be talking about how the stock and the feedback are connected to each other.
Type
Balancing: Think of the thermostat in a room; it drives the temperature of the room (the stock) to a specific range and then holds it there. These are balancing feedback loops.
Reinforcing: Because a savings account interest is based on how much is in the account, whenever you add that interest back in, there is more stock (amount in the account) and more interest will be deposited next time. This is a reinforcing feedback loop.
Delay
Feedback always reports on what has already happened. We must understand the minimum delay that each system has built into it, otherwise system behavior will oscillate as we react to the way things used to be.
Limits
We will talk about the limits for each stock/feedback pair so that you can understand them, and know when a system is operating correctly, but has just hit a limit.
A Few Examples
Let’s look at one example metric from each category so that you can see how to look at metrics with this lens.
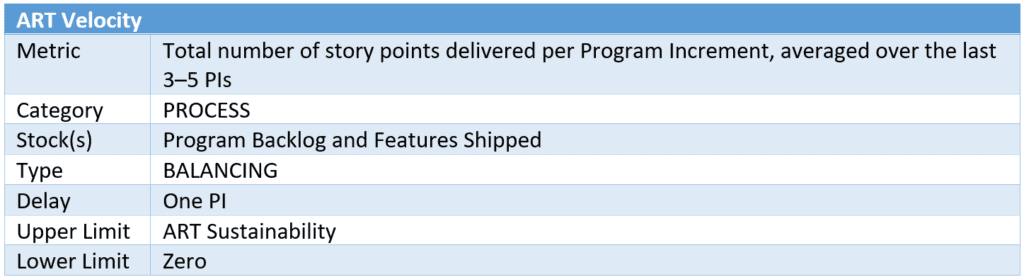
ART Velocity
Discussion:
ART velocity impacts two stocks: Program Backlog and Features Shipped, both of which are metrics themselves. In both cases, ART Velocity is a balancing loop since it is attempting to drive those metrics in particular directions. It drives Program Backlog to zero and Features Shipped steadily upward. In neither case will the stock add back into itself like an interest-bearing savings account.
The upper limit is the release train’s sustainability. So, things like DevOps culture, work-life balance, employee satisfaction, and other such concerns will all come into play in dictating the upper limit of how fast your release train can possibly go. The lower limit here is zero, but of course, coaches and leadership will intervene before that happens.
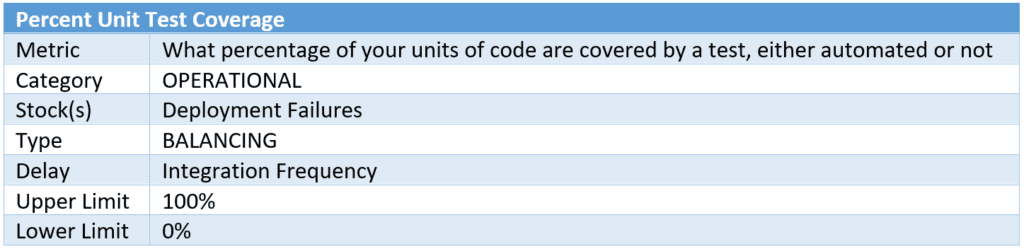
Percent Unit Test Coverage
Discussion:
Percent Unit Test Coverage is a simple metric that encapsulates the likelihood of your deployments going smoothly. The closer this metric is to 100 percent, the less troublesome your product deployments will be. The interesting point here is that the delay is strictly limited by your developers’ integration frequency, or how often they check in code. Your release train can improve the cadence of the metric by simply architecting for a faster check-in cadence.
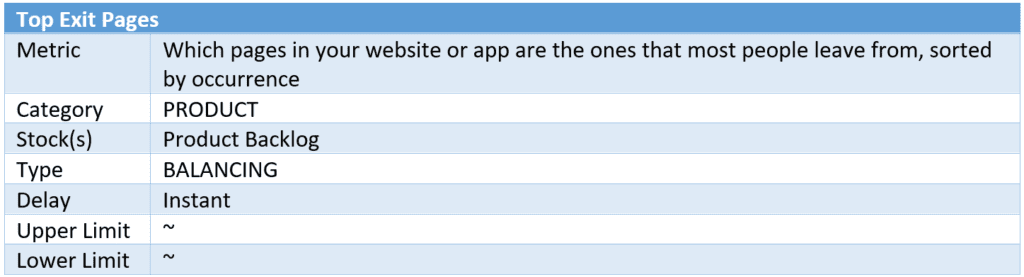
Top Exit Pages
Discussion:
This list of pages will illuminate which ones are the last pages your customers see before going elsewhere. This is very enlightening because any page other than proper logouts, or thank-you-for-your-purchase pages, is possibly problematic. Product teams should be constantly aware of top exit pages that exist anywhere within the customer journey before the value is delivered.
This metric directly impacts your product backlog but is less concerned with how much of anything is in that backlog and more of what is in there. This metric should be initiating conversations about how to remedy any potential problem that the Top Exit pages might be a symptom of.
Caution
Yes, agility fuel is in fact metrics. Actual, meaningful metrics about how things are running in your development shop. But here is the thing about metrics … I have never met a metric that I could not beat, and your developers are no different. So, how do we embrace metrics as a control measure without the agile teams working the metric to optimize their reward at the cost of effective delivery?
The answer is simple: values. In order for anything in this blog post to work, you need to be building a culture that takes care of its people, corrects errors without punitive punishment, and where trust is pervasive in all human interactions. If the leadership cannot trust the team or the team cannot trust its leadership, then these metrics can do much more harm than good. Please proceed with this cautionary note in mind.
Conclusion
This blog post has been a quick intro to a new way of looking at metrics: as agility fuel. In order to make sense of how your high-performance machine is operating you must understand the feedback loops and stocks that those loops impact. If this work interests you, please pay attention to our deep-dive blog posts over on AllisonAgile.com. Soon, we’ll be posting much more in-depth analysis of metrics and how they impact decisions that agile leaders must make.
About Allison Agile

Lee Allison is a SAFe 5.0 Program Consultant who implements Scaled Agile across the country. He fell in love with Agile over a decade ago when he saw how positively it can impact people’s work lives. He is the CEO of Allison Agile, LLC, which is central and south Texas’ original Scaled Agile Partner.
Share:
Back to: All Blog Posts
Next: Tips to Pass Your SAFe Exam and Get Certified