This blog post will illustrate, with practical examples, how the principles and practices of the Scaled Agile Framework® (SAFe®) can contribute to scaling up the circular economy.
The circular economy offers opportunities for better growth through an economic model that is resilient, distributed, diverse, and inclusive. It tackles the root causes of global challenges such as climate change, biodiversity loss, and pollution, creating an economy in which nothing becomes waste, and which is regenerative by design.
Many enterprises are committed to making their products eco-friendlier and participating in global coalitions such as The Plastics Pack. Nevertheless, due to the lack of global standards or lack of dialogue and collaboration, they could create fragmented, small-scale, and sub-optimal solutions. For example, an enterprise might design a product that contains recyclable materials, is built with mono-material components, and is easy to disassemble. Still, it would only maximize its recycling value when embedded in a functioning collection system and treated in proper recycling facilities.
What Is the Solution, Then?
Circularity is a property of a system and not of individual products. It depends on how different actors, products, and information interact with each other. Improving the whole system would require that a group of loosely coupled actors combine their business models to achieve a better collective outcome. The proposed solution is a virtual organization that aligns the strategy and execution of all the stakeholders creating a solution ecosystem.
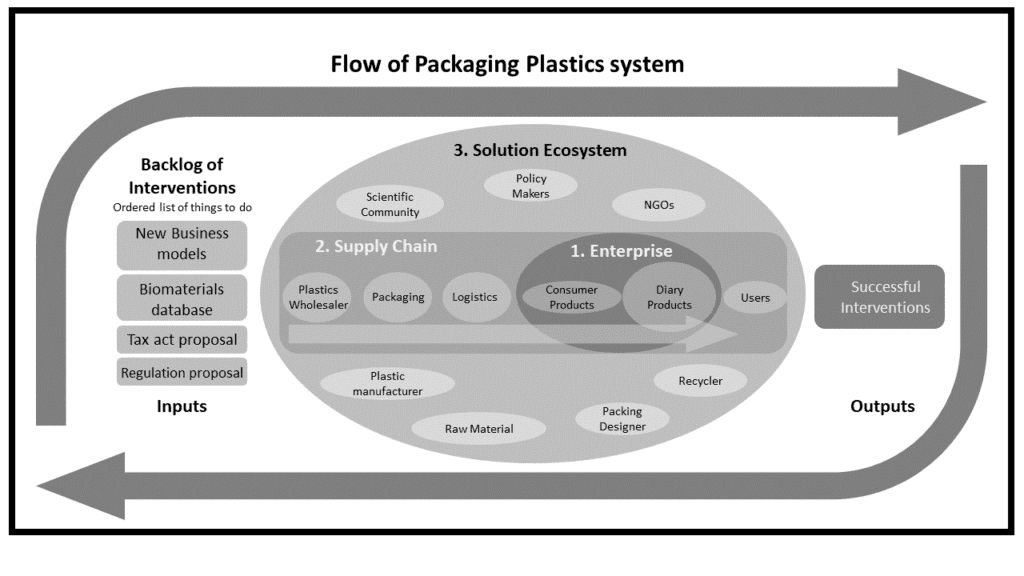
Let’s look at one example. I will illustrate a management framework to improve the packaging plastics system shown below.
Applying SAFe Principles to the Circular Economy
SAFe principle #10, Organize around value, recommends creating a virtual organization that would maximize the flow of value. It involves eliminating silos and barriers for collaboration, including the people, the processes, and the tools, from all relevant stakeholders that are trying to achieve the same outcome.
This organization would be called a solution ecosystem, and its goal will be to implement the desired changes. Following SAFe principle #2, Apply systems thinking, the solution ecosystem would include all the actors involved in or impacted by the flow of packaging plastics, from business, government, scientists, and NGOs to end-user communities, including all the necessary activities and information flows required. Decisions would be made collaboratively, iteratively, and based on science-based targets.
The objective of the solution ecosystem would be to deliver a series of interventions to improve the flow of plastics iteratively. The teams would validate each intervention hypothesis through a series of minimum viable products following a roadmap. An intervention example could be, “to get the top 20 manufacturers of packaging plastics to commit to plastic packaging that’s 100% reusable, recyclable, or compostable by 2025,” while the desired outcome would be “to reduce packaging plastics flowing into the ocean by 50%.”
The solution ecosystem comprises small, long-standing, cross-stakeholder, and cross-functional teams or teams of teams dedicated to addressing specific outcomes. They will also have access to part-time specialized resources and count on all the necessary skills to deliver value independently of other teams.
The solution ecosystem could be coordinated top-down, from organizations such as the World Economic Forum, or led by a single enterprise coordinating with all the stakeholders impacted by its products. This organization could reach out vertically to all actors along the supply chain, such as those in logistics, packaging, and wholesale, horizontally to competitors, or circularly to all stakeholders impacted.
Aligning Strategy to Execution
The solution ecosystem is likely to be composed of many people and organizations. To align strategy and execution, SAFe proposes to create a golden thread. From a single and shared vision to strategic themes to a common backlog of interventions to hold and prioritize all the interventions that will realize those themes.
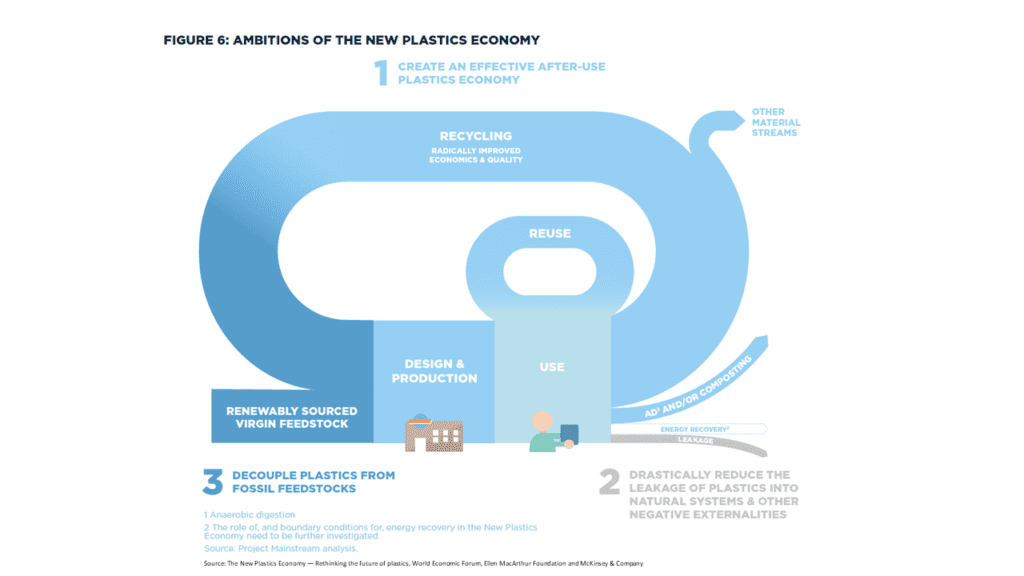
The overarching vision of the New Plastics Economy is that plastics never become waste. Instead, they re-enter the economy as valuable technical or biological nutrients, creating an effective after-use plastics economy, drastically reducing the leakage of plastics into natural systems, and decoupling plastics from fossil feedstocks.
Strategic themes are the way to achieve that vision or areas of investment. They are a way to group and classify Interventions. The solution ecosystem’s scientific community would express them in objectives and key results (OKRs). Thus, providing a qualitative and quantitative measurement to evaluate progress and success. An example could be:
Objective: Drastically reduce leakage of plastics into natural systems.
- Key result 1: Improve after-use infrastructure in high-leakage countries by x%
- Key result 2: Increase the economic attractiveness of keeping materials in the system
- Key result 3: Increase investments in efforts related to substances of concern by x %
The teams would strive to accomplish the strategic themes by implementing a series of interventions. The solution ecosystem’s backlog is the prioritized list of interventions to be done. For example, it might look like this:
- Bio-benign materials
- Reversible adhesives
- Super-polymer
- Plastics toolkit for policymakers
- Bid data service to track the flow of dangerous chemicals
- Food delivery containers as a service
Collaborative Decision-making Process
SAFe recommends using Participatory Budgeting (PB) as a tool for budget allocation across the same enterprise business units. We could expand PB for multi-stakeholder decision-making, as many municipalities use it, gathering all the stakeholders’ voices. All the stakeholders impacted would be heard, voice their concerns, choose their priorities, and learn about other stakeholders’ concerns. The PB process should be done periodically to create a rolling wave agreed plan.
Creating a Balanced Portfolio
To maintain a well-balanced portfolio, SAFe proposes several budget guardrails:
- Capacity allocation: This technique classifies interventions into different types and allocates a percentage of the available capacity to each kind, such as building the basic science, writing communications material for end-users, or drafting policy documents. Every three months, we can decide the percentage allocation to each type, keeping the desired balance across all categories.
- Investment horizons: Classifying interventions by their impact timeframe allows leadership to maintain the right balance between the immediate, short, and long term. Quick wins are needed to win the hearts and minds of the naysayers, while the more difficult things usually take longer.
- Epic approval: Decentralizing decision making is fundamental to reduce time-to-market and to improve flow. Nevertheless, substantial initiatives that impact multiple stakeholders need to go through an approval process based on a short business case.
Project to Product
The traditional project approach would have required well-defined Interventions with fixed scope, fixed budget, and a fixed timeframe, such as building a clearly defined database of biomaterials at the cost of £2m over one year. One major drawback of this approach is that the success criteria of the intervention usually focus more on staying within these artificial constraints rather than on achieving the desired outcome of increasing the percentage of biomaterials used in packaging plastics by x%. Another problem is that designs and plans must be agreed upon upfront to obtain funding and approval. At that moment is when we know the least about the problem and the solution. Hence, it becomes harder to pivot later if needed.
The book Project to Product proposes a product approach, where funding is associated with long-standing teams working on a set of interventions related to the desired outcome. They would iteratively validate hypotheses and measure progress irrespective of the validity of their initial plans and assumptions. Products must be launched and maintained during their life cycle and have multiple target users with evolving needs.
For instance, the budget would be related to a product called ‘biomaterials for packaging,’ including research, product launch, product support in life, and end-of-life activities, rather than related to a project to launch a new packaging material.
Timeboxing
SAFe principle #1, Take an economic view, proposes that we work incrementally and iteratively. Working in small timeboxes and on small pieces of independently valuable work would allow us to obtain the best economic outcome. We will get quick feedback; the value will get accumulated over time, and it will enable us to test our hypothesis and pivot quickly if needed.
SAFe principle #7, Cadence and synchronization, promotes that all teams involved in the solution ecosystem get together every three months to collaboratively plan the work for the next three months. This recurrent process helps evaluate progress toward the shared outcome, manage cross-team dependencies, and facilitate cross-team collaboration to create a stable and predictable rhythm of key events.
Every three months, all teams demonstrate their accomplishments to evaluate progress objectively. They would get together to reflect on how they deliver value and look for opportunities to improve the process.
Epic Owner
The Epic Owner is a new role that would work at the solution ecosystem level to track and shepherd the intervention through its life cycle and across all the teams involved. In our example, the Epic Owner for the biomaterials database would be accountable to define the scope, building the short business case, getting it approved, building the teams across all stakeholders, tracking progress, being a consultant to the delivery teams, and evaluating whether they are meeting the desired outcome. It is a role, not a title. Hence, it might be fulfilled by a group of people.
Transparency
Transparency and visualization of all the work and all the dependencies by everyone are key. Kanban boards would allow us to see every intervention’s status to match demand with available capacity. A dependency board would show when each intervention will be delivered and its dependencies with other teams.
Decentralized Decision-making
No amount of central planning will be enough at this scale. To enable decentralized decision-making, we need to create a framework that provides organizational clarity and technical competence. This would allow individual teams to make decisions independently with the confidence that those will be good decisions. An example could be that a team can decide to increase the cost of the solution up to £1,000 to produce an additional reduction on the amount of plastics leakage into the ocean, as long as there is no impact on any of the other planetary boundaries.
References and Sources of Inspiration
Several reports are calling for organizations like the proposed solution ecosystem that could lead a multi-stakeholder systemic change:
- The Metabolic Institute proposed that The Netherlands implements a regional ecosystem approach to scale up circular economy innovation.
- The Ellen MacArthur Foundation calls for a global, independent collaboration initiative that brings together all actors across the value chain from consumer goods companies, plastic packaging producers, plastics manufacturers to cities, businesses involved in the collection, sorting and reprocessing, policymakers, and NGOs.
- J. Konietzko writes, “Ecosystem innovation aims at changing how actors relate to each other and how they interact to achieve the desired outcome… circular products and services often maximize their circularity in conjunction with other assets. A circular ecosystem perspective thus goes beyond the question, what is our value proposition? Instead, it asks, how does our offering complement other products and services that together can provide a superior and circular ecosystem value proposition?”
- D. Meadow, in her book Thinking in Systems, says, “You can’t predict a system, but you can dance with it.” Hence, do not design a solution upfront at the enterprise level, expecting the whole ecosystem to react as you hoped. Instead, implement a management framework that allows you to work iteratively at the system level, which we call the solution ecosystem; listen to the feedback, and react accordingly.
Conclusion
In this blog post, I proposed a management framework, adapted from the Scaled Agile Framework, to manage a multi-stakeholder ecosystem to scale up solutions for the circular economy. At this stage, these are ideas extrapolated from my experience in business agility transformations and my readings into the circular economy. Please get in touch with me via LinkedIn to explore these ideas further, or if you have a concrete initiative you would like to apply them to.
About Diego Groiso

As a Principal Consultant at Radtac, a Scaled Agile Partner, Diego supports companies in their Business Agility journeys as an Enterprise Agile Coach, Trainer, and Release Train Engineer. Recently, he has transformed the whole infrastructure department of a global utility company, as well as launched and coached several Agile Release Trains within the Digital Transformation Programme in a global telecom company. He has a passion for the circular economy as one of the solutions to climate change. Connect with Diego on LinkedIn.
Share:
Back to: All Blog Posts
Next: Aligning Global Teams Through Agile Program Management: A Case Study