It’s quite common for people to nod knowingly when you mention leading indicators, but in reality, few people understand them. I believe people struggle with leading indicators because they are counterintuitive, and because lagging indicators are so ingrained in our current ways of working. So, let’s explore leading indicators: what they are, why they’re important, how they’re different from what you use today, and how you can use them to improve your innovation and product development.
What Are Leading and Lagging Indicators?

Leading indicators (or leading metrics) are a way of measuring things today with a level of confidence that we’re heading in the right direction and that our destination is still desirable. They are in-process measures that we think will correlate to successful outcomes later. In essence, they help us predict the future.
In contrast, lagging indicators measure past performance. They look backwards and measure what has already happened.
Take the example of customer experience (CX). This is a lagging indicator for your business because the customer has to have the experience before you can measure it. While it’s great to understand how your customers perceive your service, by the time you discover it sucks it might be too late to do anything about it.
ROI is another example of a lagging indicator: you have to invest in a project ahead of time but cannot calculate its returns until it’s completed. In days gone by you might have worked on a new product and spent many millions, only to discover the market didn’t want it and your ROI was poor.
Online retailers looking for leading indicators of CX might look instead at page load time, successful customer journeys, or the number of transactions that failed and ended up with customer service. I often tell clients that if these leading indicators are positive, we have reason to believe that CX, when measured, will also be positive.
Don Reinertsen shares a common example of leading vs. lagging indicators: the size of an airport security line is a leading indicator for the lagging indicator of the time it takes to pass through security screening. This makes sense because if there is a large line ahead of you, the time it will take to get through security and out the other side will be longer. We can only measure the total cycle time once we’ve experienced it.
If you operate in a SAFe® context, the success of a new train PI planning (which is a lagging indicator) is predicated on leading indicators like identifying key roles, training people, getting leadership buy-in, refining your backlog, socializing it with the teams, etc.
Simple Examples of Successful Leading Indicators
The Tesla presales process is a perfect example of how to develop leading indicators for ROI. Tesla takes refundable deposits, or pre-orders, months if not years before delivering the car to their customers. Well before the cars have gone to production, the company has a demonstrated indicator of demand for its vehicles.
Back in the 90s, Zappos was experimenting with selling shoes online in the burgeoning world of e-commerce. They used a model of making a loss on every shoe sold (by not holding stock and buying retail) as a leading indicator that an online shoe selling business would be successful before investing in the necessary infrastructure you might expect to operate in this industry.
If you are truly innovating (versus using innovation as an excuse for justifying product development antipatterns, like ignoring the customer) then the use of leading indicators can be a key contributor to your innovation accounting processes. In his best-selling book, The Lean Startup, Eric Ries explains this concept. If you can demonstrate that your idea is moving forward by using validated learning to prove problems exist, then customers will show interest before you even have a product to sell. Likewise, as Dantar P. Oosterwal demonstrated in his book, The Lean Machine, a pattern of purchase orders can be a leading indicator of product development and market success.
Leading Indicators Can Be Near-term Lagging Indicators
Let’s loop back and consider the definitions of leading and lagging indicators.
- Lagging: Measures output of an activity. Likely to be easy to measure, as you’ve potentially already got measurement in place.
- Leading: Measures inputs to the activity. Often harder to measure as you likely do not do this today.
Think about the process of trying to lose weight. Weight loss is a lagging indicator, but calories consumed and exercise performed are leading indicators, or inputs to the desired outcome of losing weight.
While it’s true that both calories consumed and exercise performed are activities that cannot be measured until they’re completed, and therefore might be considered near-term lagging indicators, they become leading indicators because we’re using them on the path to long-term lagging indicators. Think back to the CX example: page load time, successful customer journeys, and failed transactions that end up with customer service can all be considered near-term lagging indicators. Yet we can use them as leading indicators on a pathway to a long-term lagging indicator, CX.

How to Ideate Your Leading Indicators
The most successful approach I’ve applied with clients over many years is based on some work by Mario Moreira, with whom I worked many moons ago. I’ve tweaked the language and application a little and recommend you create a Pathway of Leading to Lagging Indicators. To demonstrate this, I will return to the CX example.

If we walk the pathway, we can estimate that an acceptable page load time will lead to a successful user journey, which—if acceptable—will then lead to fewer failed transactions that revert to customer service, which ultimately will lead to a positive customer experience metric.
Work Backwards from Your Lagging Indicator
To create your Leading to Lagging Pathway, start from your lagging indicator and work backwards looking at key successful elements that need to be true to allow your lagging indicator to be successful.
At this stage, these are all presuppositions; as in, we believe these to be true. They stay this way until you’ve collected data and can validate your pathway. This is similar to how you need to validate personas when you first create them.
Add Feedback Loop Cycle Times
Once you have your pathway mapped out, walk the pathway forward from your first leading indicator and discuss how often you can and should record, analyze, and take action for that measure. You should make these feedback loops as short as possible because the longer the loop, the longer it will take you to learn.

All that’s left is to implement your Leading to Lagging Pathway. You may find a mix of measures, some which you measure today and some you don’t. For those you already do measure, you may not be measuring them often enough. You also need to put in place business processes to analyze and take action. Remember that if measures do not drive decisions, then your actions are a waste of resources.
Your leading indicator might be a simple MVP. Tools like QuickMVP can support the implementation of a Tesla-style landing page to take pre-orders from your customers.
Applying Leading Indicators in Agile Product Management
A common anti-pattern I see in many product management functions is a solution looking for a problem. These are the sorts of pet projects that consume huge amounts of R&D budget and barely move the needle on profitability. Using design thinking and Lean Startup techniques can help you to validate the underlying problem, determine the best solution, and identify whether it’s desired by your potential customers and is something you can deliver profitably.
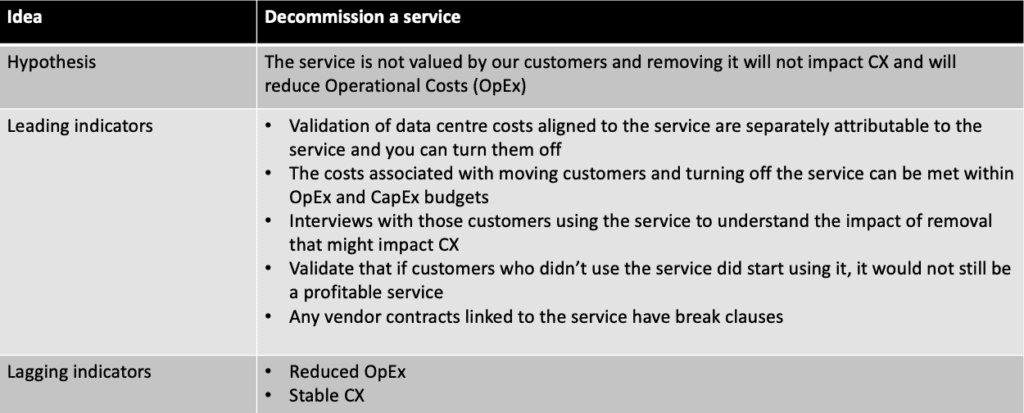
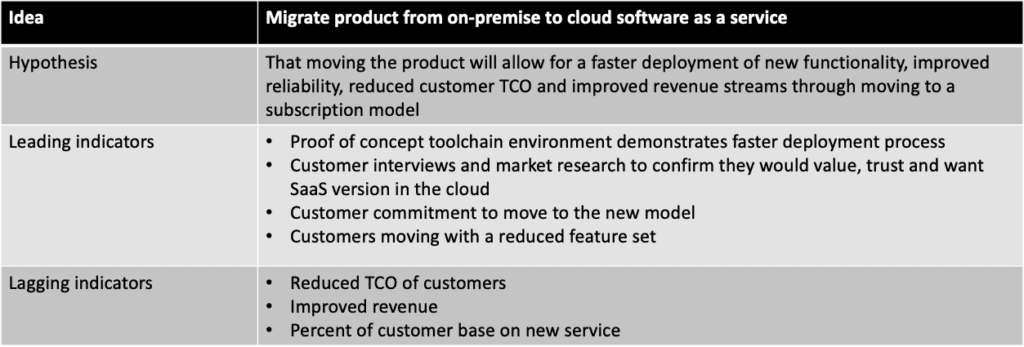
In SAFe, leading indicators are an important element of your epic benefit hypothesis statement. Leading indicators can give you a preview of the likelihood that your epic hypothesis will be proven, and they can help deliver this insight much earlier than if you weren’t using them. Insight allows you to pivot at an earlier stage, saving considerable time and money. By diverting spending to where it will give a better return, you are living by SAFe principle number one, Take an economic view.
Let’s look at some working examples demonstrating the use of leading indicators.


I hope you can now see that leading indicators are very powerful and versatile, although not always obvious when you start using them. Start with your ideation by creating a Leading to Lagging Pathway, working back from your desired lagging indicator. If you get stuck, recall that near-term lagging indicators can be used as leading indicators on your pathway too. Finally, don’t feel you need to do this alone, pair or get a group of people together to walk through this process, the discussions will likely be valuable in creating alignment in addition to the output.
Let me know how you get on. Find me on the SAFe Community Platform and LinkedIn.
About Glenn Smith

Glenn Smith is SAFe Program Consultant Trainer (SPCT), SPC, and RTE working for Radtac as a consultant and trainer out of the UK. He is a techie at heart, now with a people and process focus supporting organizations globally to improve how they operate in a Lean-Agile way. You will find him regularly talking at conferences and writing about his experiences to share his knowledge.
Share:
Back to: All Blog Posts
Next: Traits of the Stoic Agilist