Winning the Customer with Experience Architecture – Agility Planning

 Experience Architecture

As the post-digital economy begins to boom and the worlds of business process and technology come together, it’s time to think about how we optimize the whole from a unified, customer-centric perspective. Some organizations have begun to master the idea of experience architecture, whereas others are just beginning.

During my years consulting, I’ve had the opportunity to work with complex system architecture. Such as the APIs and data structures across multiple federal agencies that manage annual earnings and death records for every person in the United States. I’ve also experienced complex business architectures responsible for moving passengers, aircraft, and cargo around the world in a safe and predictable manner.

What was obvious to me in these and other scenarios was that there was no way we could treat the disciplines of business architecture and technical architecture as independent variables. Especially if these organizations hoped to keep up with the speed of innovation. In early experiments, I hypothesized that by pairing business architects with their peer application architects, we could better design experiments to achieve business outcomes that were efficient and technically sound. My hypothesis was partially proven. There were still missing pieces of the equation.

In later experiments, I treated the various architects in the value stream as an Agile team composed of all architectural perspectives that we needed to deliver the solution. Those perspectives included business architecture, application architecture, systems architecture, data architecture, information security, and even Lean Six Sigma Black Belts to help keep the group focused on flow efficiency. That experiment had some cool outcomes, though I had come to realize one obvious hole: the lack of consideration for the people in the system. We needed a different skill set. We needed experience in architecture.

Curated Experiences and Powerful Moments

In their book The Power of Moments, Chip and Dan Heath give many examples of how people remember exceptionally good and exceptionally poor experiences. The authors illustrate how average experiences are largely forgettable. Conversely, experiences that are repeated merge together so that customers develop a general perception of the experiences, but don’t remember any experience in particular.

My family visits Disney. A lot.

Before I met my wife, I’d been to Disney World twice in my life. Once when I was eight and again as a teenager. I have fond memories of each trip and can remember specific moments. These were positive experiences and here’s why.

Since having met my wife, I’ve been to Disney an average of twice annually and as many as four times in a single year. Each of those experiences has been positive, but I can’t articulate why. I know that I enjoy Animal Kingdom and the Avatar ride in Pandora. I know that the Magic Kingdom gives me anxiety and that you can get prosecco at Epcot. Unlike the trips of my youth which are memorable, not a single visit as an adult stands out. The experiences have merged.

 Experience Architecture

My Disney experience is what most customers experience as they interact with our value streams. The customer will form a general feeling and only talk about the experience: if it was exceptionally good or exceptionally bad.

Need proof? Check out the reviews on Amazon or Google. You’re likely to see mostly very positive and very negative reviews without much in the middle. There is power in moments. The moments are what we remember and they can be curated when an organization makes investments in experience architecture.

Map Value Streams and Understand the Experience

Similar to the steps of value stream identification and business architecture, the first step in articulating a customer experience is to map the operational value stream. With alignment on how the business operates, the next step in understanding the customer experience is to visualize the technology that supports the operation and the development value streams that maintain the technology. Speaking of value streams, check out this cool webinar where I talk about them with Danny Presten.

With the value streams mapped, the next step is to embark on a journey to optimize the whole by eliminating technical and operational debt. With the help of business architecture, we can leverage the time focused on improvement to begin identifying opportunities for large-scale improvement in operational throughput. Additionally, the organization can begin investing in capability modeling with the goal of running more experiments for strategy implementation, faster.

With the operational value stream mapped, the underlying architecture understood, and a commitment made to relentless improvement, we can now begin exploring the customer experience.

Map the Experience

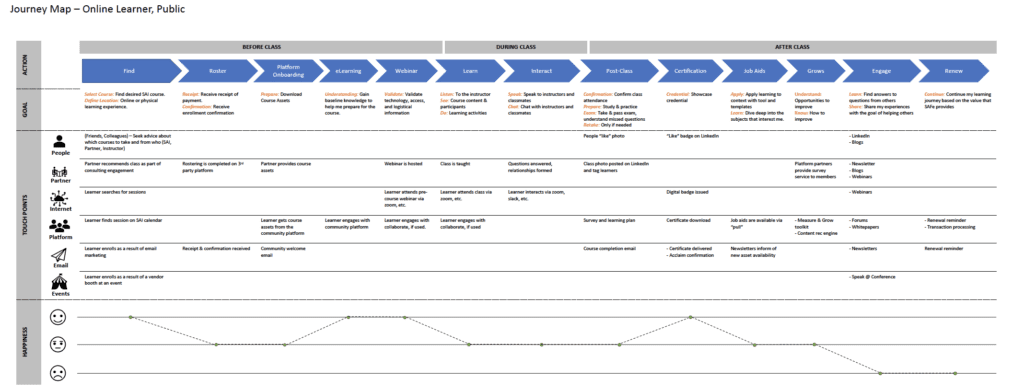
Now that we’re ready to map the customer experience, we begin by seeking to better understand the customer. SAFe® advocates using design thinking as a framework for customer centricity to best use personas, empathy maps, and experience maps. The art of experience mapping follows similar best practices used in other forms of value stream mapping. The distinct difference is that we engage with customers to understand their journey from their perspective.

Below is an example of an experience map that depicts the experience of an online public learner in the SAFe ecosystem. At the top, you’ll notice the phases of the customer journey, followed by the operational value stream. We continue by seeking to understand the customer’s goal within each component of the value stream, the touchpoints that Scaled Agile has with the customer, and finally, the customer’s happiness after having completed the operational component.

Similar to other types of value stream mapping, with the customer experience articulated, we can now start on a path to relentlessly improve the customer experience and curate memorable moments.
 Experience Architecture

Curate Unforgettable Moments

The Heath brothers explain the power of moments as a key theme in their book. For me, the true power of moments became evident when I purchased a new home in July of 2020. Veterans United Home Loans has made a significant investment in its customer experience and has taken advantage of the power of moments. The proof? The fact that nearly a year later I am blogging about my mortgage experience.

If you’ve ever bought a home, you can probably empathize when I say that it’s a stressful experience. In any mortgage transaction there are two particularly stressful phases for future homeowners: approval, and more notably, underwriting. Through their work in experience mapping, Veterans United was able to recognize this and curate moments to help ease the stress a little. When I received the approval for my home, my mortgage broker, Molly (do you remember the name of your mortgage broker?), sent me a pair of Veterans United socks.

 Experience Architecture

Yes, socks. They weren’t the best quality, they were kind of corny, but they made me smile and I’m still talking about them. Moment curated. 

When I closed underwriting, the curated moment was a little more personal. Molly had done her homework and knew that I liked to barbecue. So, she sent me a nice set of outdoor cooking utensils. As you sit there and ponder the ROI on socks and cooking tools, remember that you now know about Molly and Veterans United. ROI achieved. 

What low-cost, high-impact moments can you curate for your customers? How can you turn an otherwise forgettable experience into something that people remember for years to come? These actions are key to winning in the post-digital economy. Consumers want to know your organization is human. They want to know that you care. What can you do to help make that connection?

Experience Architecture: Conclusion

Success in the post-digital economy will require business agility and a clear focus on the customer. Experience architecture is something organizations should employ to better understand the customer so they can release on demand, as determined by the market and customer.

If you’re an experienced experience architect, consider sharing your stories in our General SAFe Discussion Group on the SAFe Community Platform. To learn more about working with varying architectural disciplines, while maximizing the amount of work not done, and embracing a just enough, just-in-time approach, check out these architectural runway articles.

About Adam Mattis

Adam Mattis headshot

Adam Mattis is a SAFe Program Consultant Trainer (SPCT) at Scaled Agile with many years of experience overseeing SAFe implementations across a wide range of industries. He’s also an experienced transformation architect, engaging speaker, energetic trainer, and a regular contributor to the broader Lean-Agile and educational communities. Learn more about Adam at adammattis.com.

View all posts by Adam Mattis

Share:

Back to: All Blog Posts

Next: Aligning Global Teams Through Agile Program Management: A Case Study
VoC: The Power of Customer Feedback in Prioritizing Work – Agility Planning

Welcome to the third post in our value stream identification in practice blog series. You can read the first post here about preparing for a successful workshop. And the second post here with helpful tips for identifying value streams. 

Power of Customer Feedback

The Scaled Agile Voice of the Customer (VoC) is a community of our most inspiring customers. All of whom are driving measurable change at their organizations. 

This group of individuals comes together—virtually and twice a year—to share, connect with each other, and give us feedback to help us prioritize our most important work. Pretty simple, right? But very powerful in practice.

That power resides in how the VoC has been designed to promote continuous exploration and customer centricity. Each time we meet, we do exercises that encourage our community to look both backward (this is what we built based on your previous feedback) and forward (defining what our epic priorities should be). For example, at our last VoC event, Dean Leffingwell spent some time reviewing what we had worked on over the past six months.

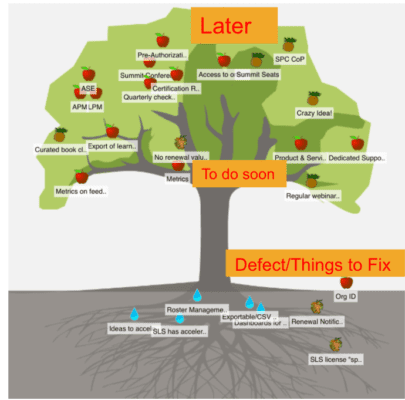
We also went through an exercise called “Prune the Product Tree,” which is designed to reveal the features most important to our customers. Participants place apples, which represent features, onto a tree. Items nearest the trunk are a higher priority than those placed farther up the tree. 

From our customers, we heard quite clearly that organizing around value was the top-rated epic. The overwhelming agreement within the community around this feature kicked off a renewed internal focus on Principle #10: organizing around value. Although we now had our purpose, we weren’t sure how to get started, nor what part of organizing or mapping value was the biggest challenge. So before jumping in and creating new tools and materials, we went back to our community to gain more clarity about the needs.

a chart depicting an exercise known as "Prune the Product Tree"

We asked some of our participants to spend 30 minutes with us in an empathy interview. We wrote a script of eight, open-ended questions designed to help us understand how organizing around value applies to their context. The questions were intended to uncover the obstacles they faced in organizing around value. Some of the biggest challenges were related to preparing for the workshop and getting executive buy-in to attend. One aha moment was when we learned how many organizations stand up ARTs without relying on the Value Stream Identification Workshop. So, our new guidance would actually need to reflect that reality. 

Now that we had a sense of next steps, we knew it was important to bring our customers along for the journey to keep us moving in the right direction. We created a study group representing a smaller subset of our VoC community. As the name implies, this group’s purpose is to gather and apply a critical eye to new intellectual property and how it serves the challenges they identify. 

This VoC study group has been critical in helping us understand the complexities large organizations face as they organize around value. But we’re not finished yet! With this group’s help, we’re developing new pre-workshop guidance. Our goal is to create new tools that will better serve our internal champions by:

  • Generating buy-in: getting executive level and internal support for holding the workshop. The 10 Tips for Value Stream Identification blog post is a good place to start. 
  • Preparing for the workshop: tasks that should be completed to ensure a more successful workshop. Read more in the Three Steps to Prepare for a Successful Value Stream Workshop blog post.
  • Facilitating the workshop: guidance for creating an interactive and action-oriented event.
  • Taking action: tips for implementing workshop results. 

In fact, we’re testing it out this quarter with the study group. And, as always, keeping the customer at the center as we design, test, and iterate. 

Want to see the impact of the group’s feedback on early guidance? Some of the updates include:

  • Value Stream and ART Identification Workshop toolkit. Or, navigate to the “Implement” tab on the SAFe Community Platform, selecting “SAFe Toolkits & Templates,” then selecting “SAFe Value Stream and ART Identification Workshop Toolkit 5.1.” 
  • What’s new in SAFe 5? How about Operational Value Streams as first-class citizens?

About Jennifer Roberts

Jennifer Roberts leads the Voice of the Customer community

Jennifer Roberts leads the Voice of the Customer community within the Marketing Enterprise Solutions team. Prior to joining Scaled Agile, she worked at Cisco where she led the global social selling and demand generation team. She lives in Boulder, Colorado and does not believe chili has beans.

View all posts by Jennifer Roberts

Share:

Back to: All Blog Posts

Next: 10 Tips for Value Stream Identification

Understanding Leading Indicators in Product Development and Innovation

It’s quite common for people to nod knowingly when you mention leading indicators, but in reality, few people understand them. I believe people struggle with leading indicators because they are counterintuitive, and because lagging indicators are so ingrained in our current ways of working. So, let’s explore leading indicators: what they are, why they’re important, how they’re different from what you use today, and how you can use them to improve your innovation and product development.

What Are Leading and Lagging Indicators?

Leading Indicators in Product Development

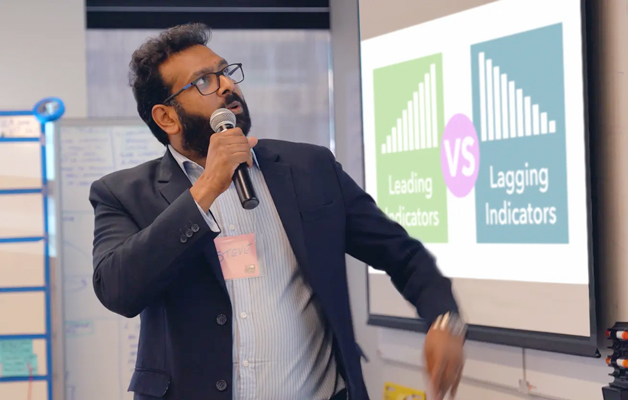
Leading indicators (or leading metrics) are a way of measuring things today with a level of confidence that we’re heading in the right direction and that our destination is still desirable. They are in-process measures that we think will correlate to successful outcomes later. In essence, they help us predict the future.

In contrast, lagging indicators measure past performance. They look backwards and measure what has already happened.

Take the example of customer experience (CX). This is a lagging indicator for your business because the customer has to have the experience before you can measure it. While it’s great to understand how your customers perceive your service, by the time you discover it sucks it might be too late to do anything about it.

ROI is another example of a lagging indicator: you have to invest in a project ahead of time but cannot calculate its returns until it’s completed. In days gone by you might have worked on a new product and spent many millions, only to discover the market didn’t want it and your ROI was poor.

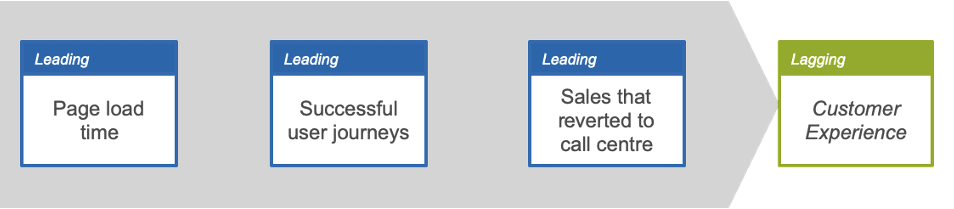
Online retailers looking for leading indicators of CX might look instead at page load time, successful customer journeys, or the number of transactions that failed and ended up with customer service. I often tell clients that if these leading indicators are positive, we have reason to believe that CX, when measured, will also be positive.

Don Reinertsen shares a common example of leading vs. lagging indicators: the size of an airport security line is a leading indicator for the lagging indicator of the time it takes to pass through security screening. This makes sense because if there is a large line ahead of you, the time it will take to get through security and out the other side will be longer. We can only measure the total cycle time once we’ve experienced it.

If you operate in a SAFe® context, the success of a new train PI planning (which is a lagging indicator) is predicated on leading indicators like identifying key roles, training people, getting leadership buy-in, refining your backlog, socializing it with the teams, etc.

Simple Examples of Successful Leading Indicators

The Tesla presales process is a perfect example of how to develop leading indicators for ROI. Tesla takes refundable deposits, or pre-orders, months if not years before delivering the car to their customers. Well before the cars have gone to production, the company has a demonstrated indicator of demand for its vehicles.

Back in the 90s, Zappos was experimenting with selling shoes online in the burgeoning world of e-commerce. They used a model of making a loss on every shoe sold (by not holding stock and buying retail) as a leading indicator that an online shoe selling business would be successful before investing in the necessary infrastructure you might expect to operate in this industry.

If you are truly innovating (versus using innovation as an excuse for justifying product development antipatterns, like ignoring the customer) then the use of leading indicators can be a key contributor to your innovation accounting processes. In his best-selling book, The Lean Startup, Eric Ries explains this concept. If you can demonstrate that your idea is moving forward by using validated learning to prove problems exist, then customers will show interest before you even have a product to sell. Likewise, as Dantar P. Oosterwal demonstrated in his book, The Lean Machine, a pattern of purchase orders can be a leading indicator of product development and market success.

Leading Indicators Can Be Near-term Lagging Indicators

Let’s loop back and consider the definitions of leading and lagging indicators.

  • Lagging: Measures output of an activity. Likely to be easy to measure, as you’ve potentially already got measurement in place.
  • Leading: Measures inputs to the activity. Often harder to measure as you likely do not do this today.

Think about the process of trying to lose weight. Weight loss is a lagging indicator, but calories consumed and exercise performed are leading indicators, or inputs to the desired outcome of losing weight.

While it’s true that both calories consumed and exercise performed are activities that cannot be measured until they’re completed, and therefore might be considered near-term lagging indicators, they become leading indicators because we’re using them on the path to long-term lagging indicators. Think back to the CX example: page load time, successful customer journeys, and failed transactions that end up with customer service can all be considered near-term lagging indicators. Yet we can use them as leading indicators on a pathway to a long-term lagging indicator, CX.

Leading Indicators in Product Development

How to Ideate Your Leading Indicators

The most successful approach I’ve applied with clients over many years is based on some work by Mario Moreira, with whom I worked many moons ago. I’ve tweaked the language and application a little and recommend you create a Pathway of Leading to Lagging Indicators. To demonstrate this, I will return to the CX example.

Ideate Leading Indicators

If we walk the pathway, we can estimate that an acceptable page load time will lead to a successful user journey, which—if acceptable—will then lead to fewer failed transactions that revert to customer service, which ultimately will lead to a positive customer experience metric.

Work Backwards from Your Lagging Indicator

To create your Leading to Lagging Pathway, start from your lagging indicator and work backwards looking at key successful elements that need to be true to allow your lagging indicator to be successful.

At this stage, these are all presuppositions; as in, we believe these to be true. They stay this way until you’ve collected data and can validate your pathway. This is similar to how you need to validate personas when you first create them.

Add Feedback Loop Cycle Times

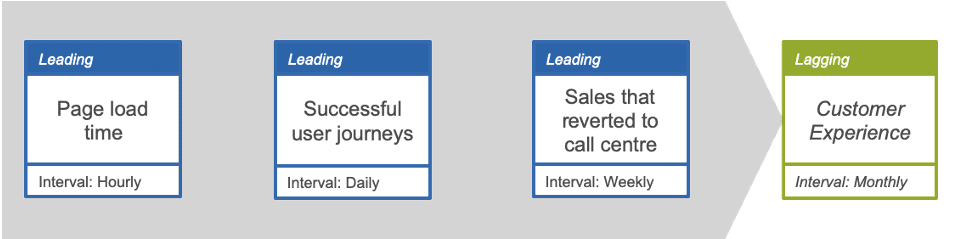
Once you have your pathway mapped out, walk the pathway forward from your first leading indicator and discuss how often you can and should record, analyze, and take action for that measure. You should make these feedback loops as short as possible because the longer the loop, the longer it will take you to learn.

Feedback Loop Cycle

All that’s left is to implement your Leading to Lagging Pathway. You may find a mix of measures, some which you measure today and some you don’t. For those you already do measure, you may not be measuring them often enough. You also need to put in place business processes to analyze and take action. Remember that if measures do not drive decisions, then your actions are a waste of resources.

Your leading indicator might be a simple MVP. Tools like QuickMVP can support the implementation of a Tesla-style landing page to take pre-orders from your customers.

Applying Leading Indicators in Agile Product Management

A common anti-pattern I see in many product management functions is a solution looking for a problem. These are the sorts of pet projects that consume huge amounts of R&D budget and barely move the needle on profitability. Using design thinking and Lean Startup techniques can help you to validate the underlying problem, determine the best solution, and identify whether it’s desired by your potential customers and is something you can deliver profitably.

In SAFe, leading indicators are an important element of your epic benefit hypothesis statement. Leading indicators can give you a preview of the likelihood that your epic hypothesis will be proven, and they can help deliver this insight much earlier than if you weren’t using them. Insight allows you to pivot at an earlier stage, saving considerable time and money. By diverting spending to where it will give a better return, you are living by SAFe principle number one, Take an economic view.

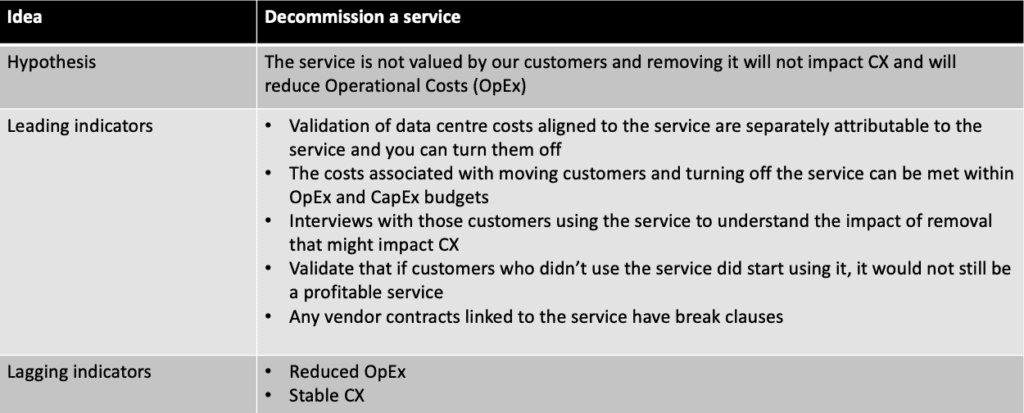
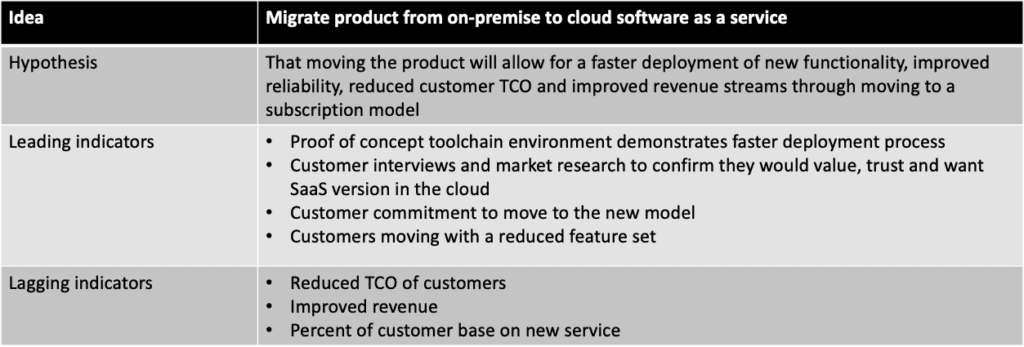
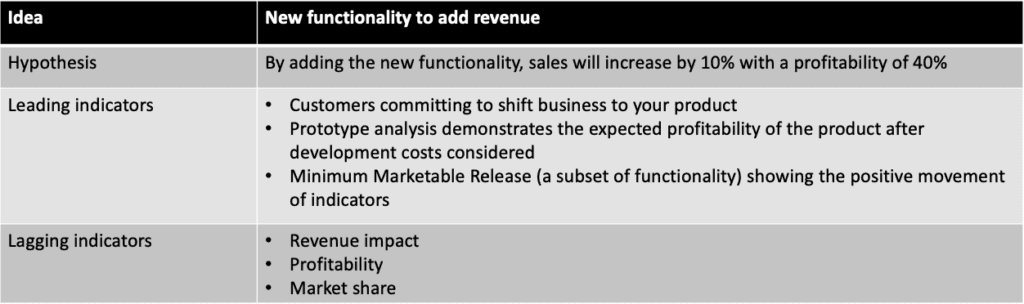
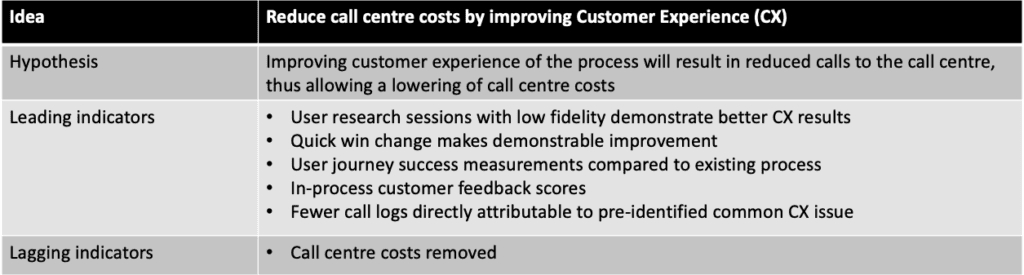
Let’s look at some working examples demonstrating the use of leading indicators.

Leading Indicators in Agile Product Management

I hope you can now see that leading indicators are very powerful and versatile, although not always obvious when you start using them. Start with your ideation by creating a Leading to Lagging Pathway, working back from your desired lagging indicator. If you get stuck, recall that near-term lagging indicators can be used as leading indicators on your pathway too. Finally, don’t feel you need to do this alone, pair or get a group of people together to walk through this process, the discussions will likely be valuable in creating alignment in addition to the output.

Let me know how you get on. Find me on the SAFe Community Platform and LinkedIn.

About Glenn Smith

Glenn Smith is SAFe Program Consultant Trainer (SPCT), SPC, and RTE

Glenn Smith is SAFe Program Consultant Trainer (SPCT), SPC, and RTE working for Radtac as a consultant and trainer out of the UK. He is a techie at heart, now with a people and process focus supporting organizations globally to improve how they operate in a Lean-Agile way. You will find him regularly talking at conferences and writing about his experiences to share his knowledge.

View all posts by Glenn Smith

Share:

Back to: All Blog Posts

Next: Traits of the Stoic Agilist

Allianz Global Corporate and Specialty SE – Reaching SAP Business Agility with SAFe

Customer Story – Allianz: AGCS’ SAFe Journey To Become a Data Driven Enterprise

Share:

After multiple mergers, our data systems were disjointed. To add to this, the newest International Financial Reporting Standard (IFRS17) is set to go into effect in January 2023, making data management crucial from a regulatory perspective. We implemented the latest version of SAPHANA, a database management system in partnership with Accenture. This brought our data together under a centralized solution while offering near real-time data processing and better reporting and analytics.

SAFe provided the structure we needed to scale Agile in a complex SAP and non-SAP landscape. SAFe allowed us to organize around value and grow seamless integrated cross-functional teams aligned with the company’s long-term strategy. At Allianz Global Corporate our SAP DevSecOps automation pipeline helped to reach SAP Delivery Agility which paved the way to build the capabilities needed to reach SAP Business Agility. SAFe addressed the complexities and gave us the framework for building portfolios, roles, and jobs to achieve our goals for customer centricity, speed, and quality. DevSecOps is a mindset, an enterprise-wide culture and practice. We will showcase how Allianz Global Corporate applied the five core concepts of DevSecOps and Release on Demand across the five core concepts and become a Data-Driven Enterprise.

Presented at the Global SAFe Summit, October, 2020.

Back to: Customer Stories

Next: TV Globo Customer Story