Real options promote flexibility in decision-making and enable organizations to pivot, change course, or seize new opportunities as circumstances evolve.
When:
May 21, 2024, 12:00 pm – May 21, 2024, 1:00 pm MST
Where:
Zoom
Who:
Consultant, Director, LACE Member, Program or Project Manager, SAFe Program Consultant, Transformation Leader
Applying OKRs in SAFe® to Create Clear Goals and Measure Outcomes
Join Amit Kaulagekar and Rohini Sharma, Industry Lead monday.com online session to help you deconstruct the concepts and provide practical application to bring it from concept to execution.
Objectives and Key Results (OKRs) is a collaborative framework for establishing clear goals and measurable outcomes. When used within SAFe, OKRs can help to support the Core Values of transparency and alignment between the Enterprise and Portfolio strategy and the work of the Agile Release Trains and Agile Teams to deliver on this strategy. Additionally, OKRs can be applied to measure organizational improvement activities, including the desired outcomes for the SAFe transformation. Join Amit Kaulagekar and Rohini Sharma, Industry Lead monday.com online session to help you deconstruct the concepts and provide practical application to bring it from concept to execution.
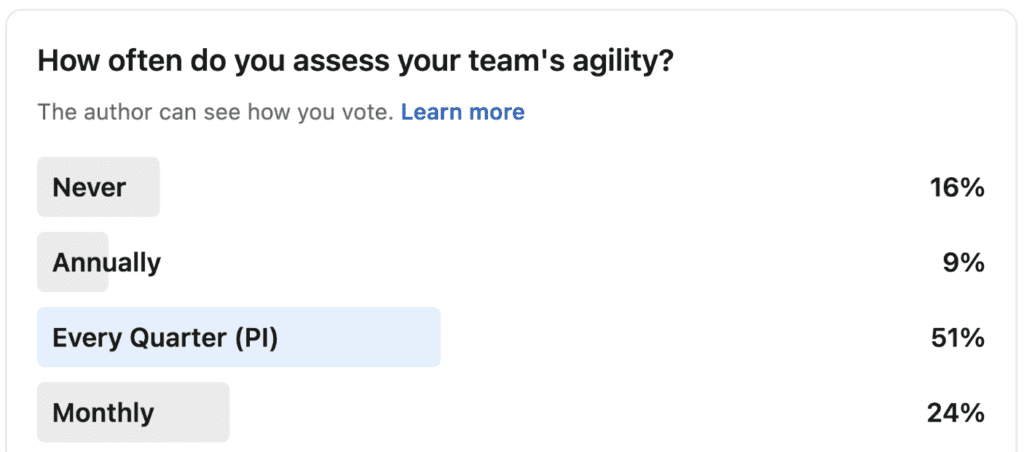
Before writing this article, we were curious to know more about how often teams are measuring their agility (if ever). We ran an informal poll on LinkedIn, and the results were fascinating.
Assessing your team’s agility is a crucial step toward continuous improvement. After all, you can’t get where you want to go if you don’t know where you are.
But you probably have questions: How do you measure a team’s agility? Who should do it and when? What happens with the data you collect, and what should you do afterwards?
We’re here to answer these questions. Use the following sections to guide you:
What is Team and Technical Agility?
What is the team and technical agility assessment?
Assessment tips, including before, during, and after you assess
Team and technical agility assessment resources
These sections include a video showing where to find the team and technical agility assessment in SAFe® Studio and what the assessment looks like.
What Is Team and Technical Agility?
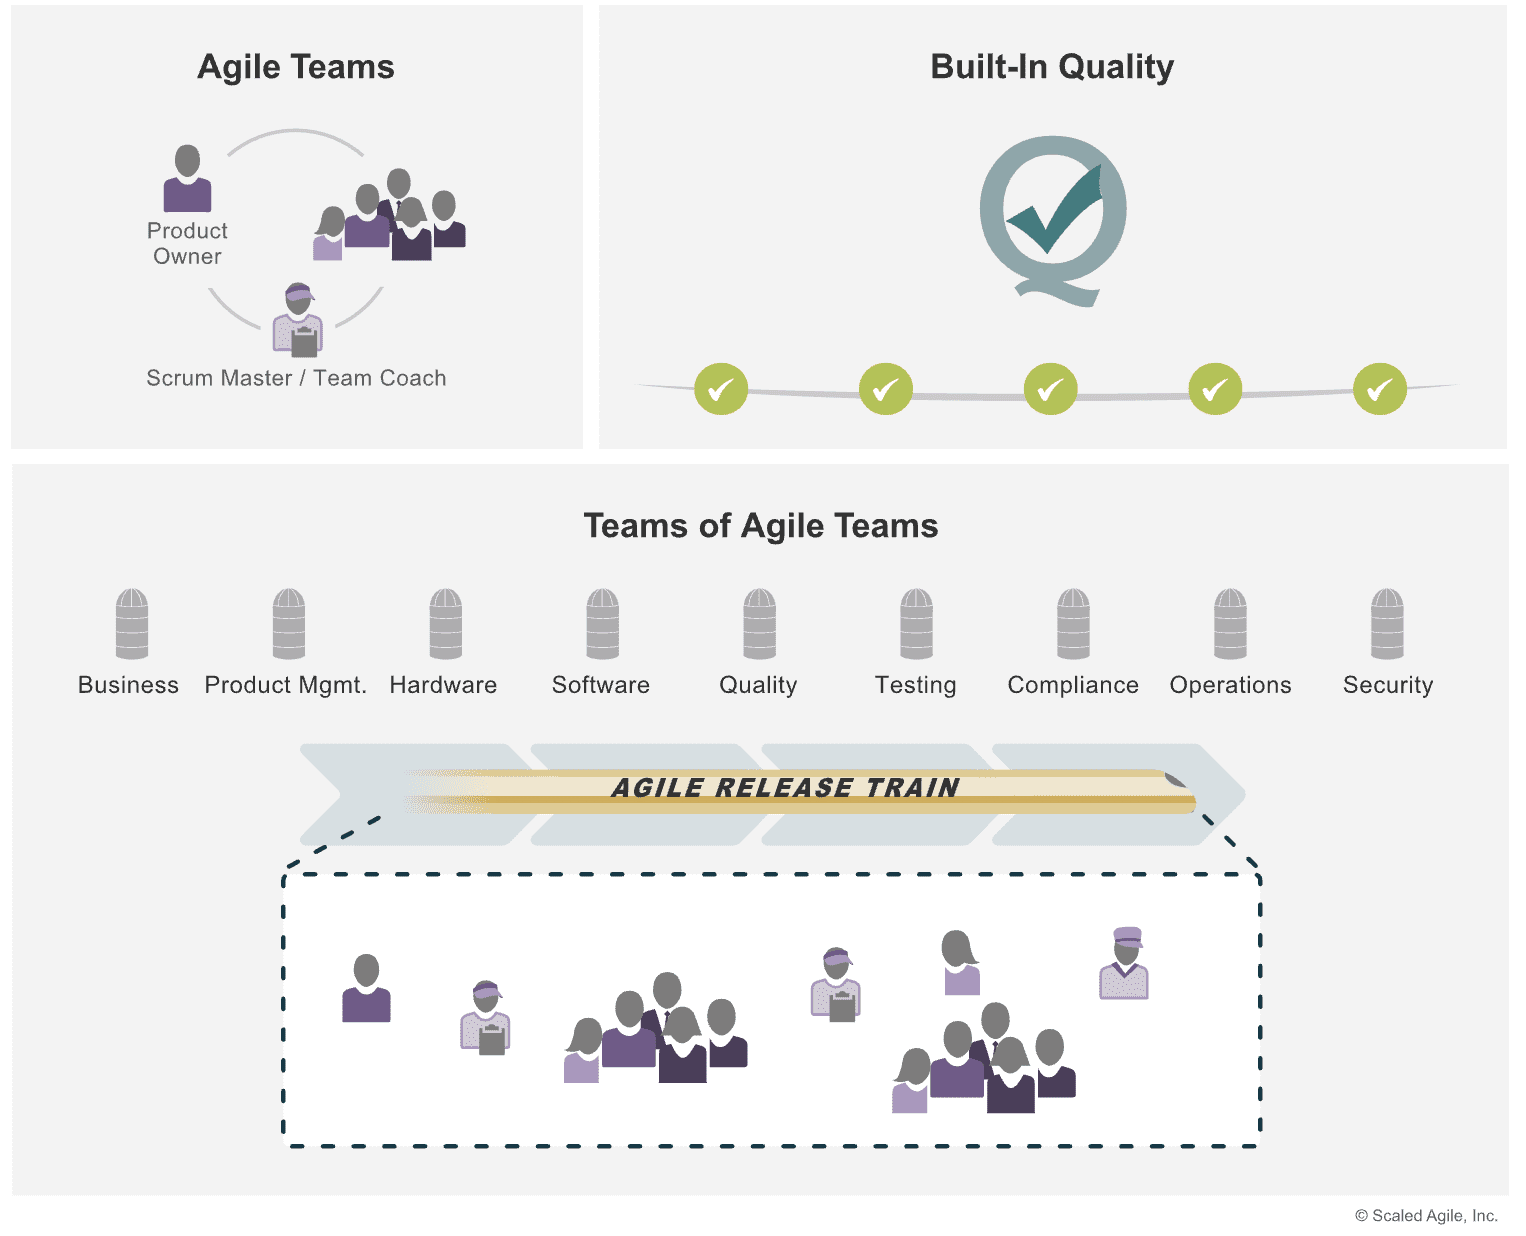
The three dimensions of team and technical agility
Before jumping into the assessment, it’s important to understand team and technical agility. This will help determine if you want to run the assessment and which areas may be most beneficial for your team.
Team and technical agility is a team’s ability to deliver solutions that meet customers’ needs. It’s one of the seven business agility core competencies.
They’re the ones on the ground bringing the product roadmap to life. They must also plan, commit, and improve together to execute in unison.
Teams of Agile teams
An ART is where Agile teams work together to deliver solutions. The ART has the same responsibilities as the Agile team but on a larger scale. The ART also plans, commits, executes, and improves together.
Built-in quality
Since Agile teams and ARTs are responsible for building products and delivering value, they must follow built-in quality practices. These practices apply during development and the review process.
As we state in the Framework article: “Built-in quality is even more critical for large solutions, as the cumulative effect of even minor defects and wrong assumptions may create unacceptable consequences.”
It’s important to consider all three areas when assessing your team’s agility.
What Is the Team and Technical Agility Assessment?
The team and technical agility assessment is a review tool that measures your team’s agility through a comprehensive survey and set of recommendations.
However, there’s more to it than that. We’ll review the information you need to fully understand what you learn from this assessment and how to access it.
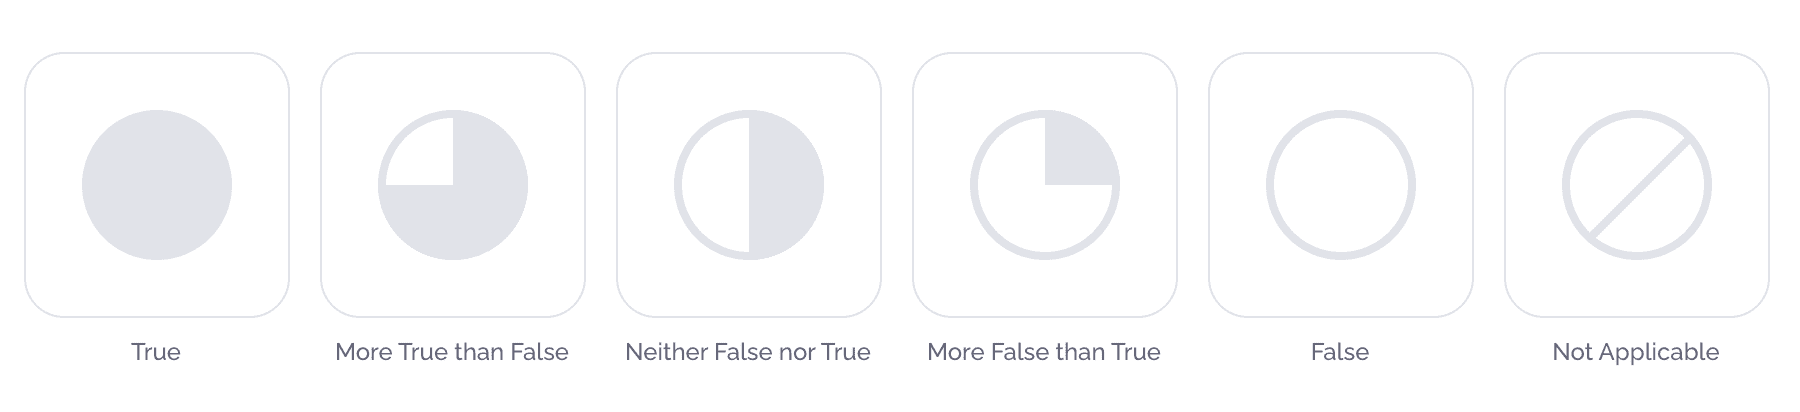
Each question in the assessment asks team members to rate statements about their teams on the following scale:
True
More True than False
Neither False nor True
More False than True
False
Not Applicable
What information can I get from the team and technical agility assessment?
Team and technical agility assessment helps teams identify areas for improvement, highlight strengths worth celebrating, and benchmark performance against future progress. It asks questions like the following about how your team operates:
Do you use technical practices like test-driven development and peer review?
How does your team tackle technical debt?
For facilitators, including Scrum Masters/Team Coaches (SM/TC), the team and technical agility assessment is a great way to create space for team reflection beyond a typical retrospective. It can also increase engagement and buy-in for the team to take on actionable improvement items.
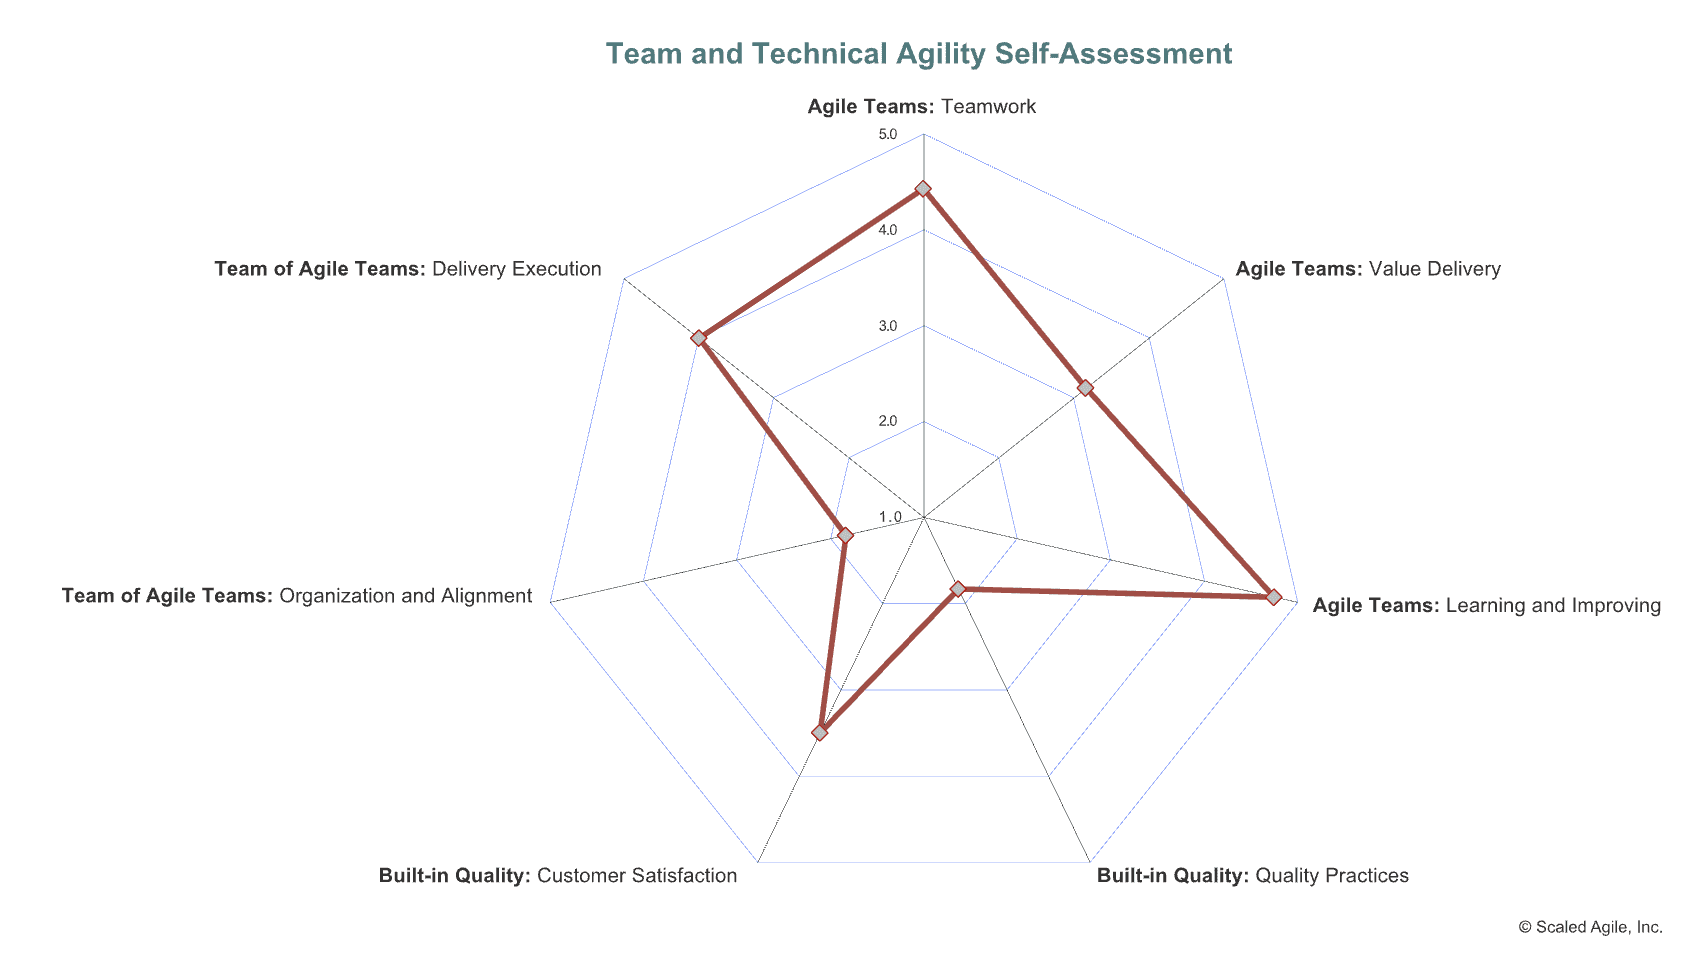
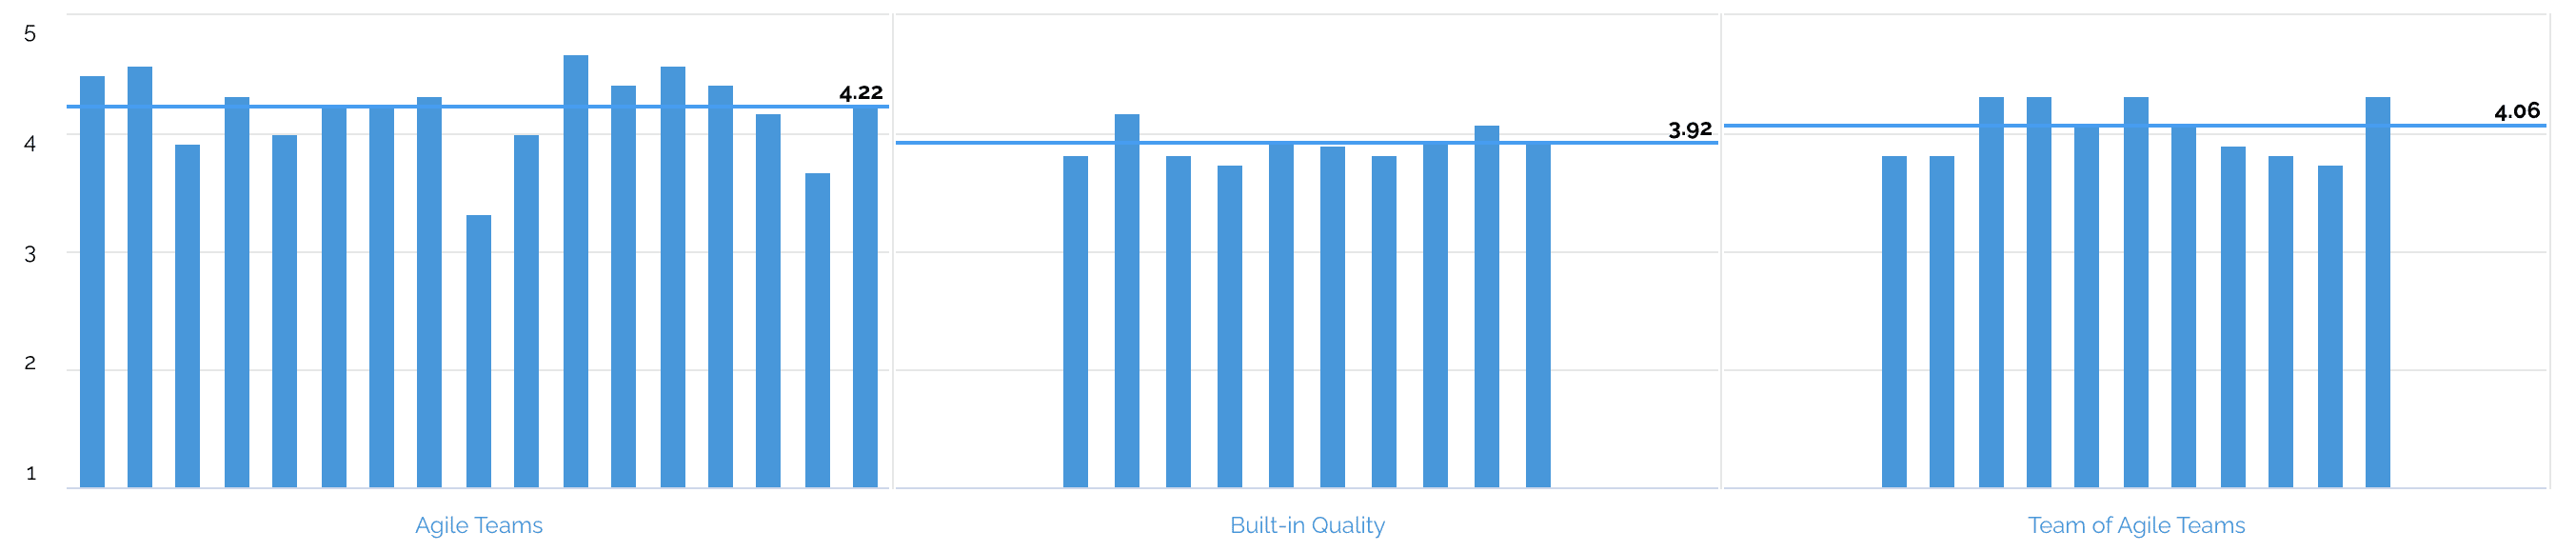
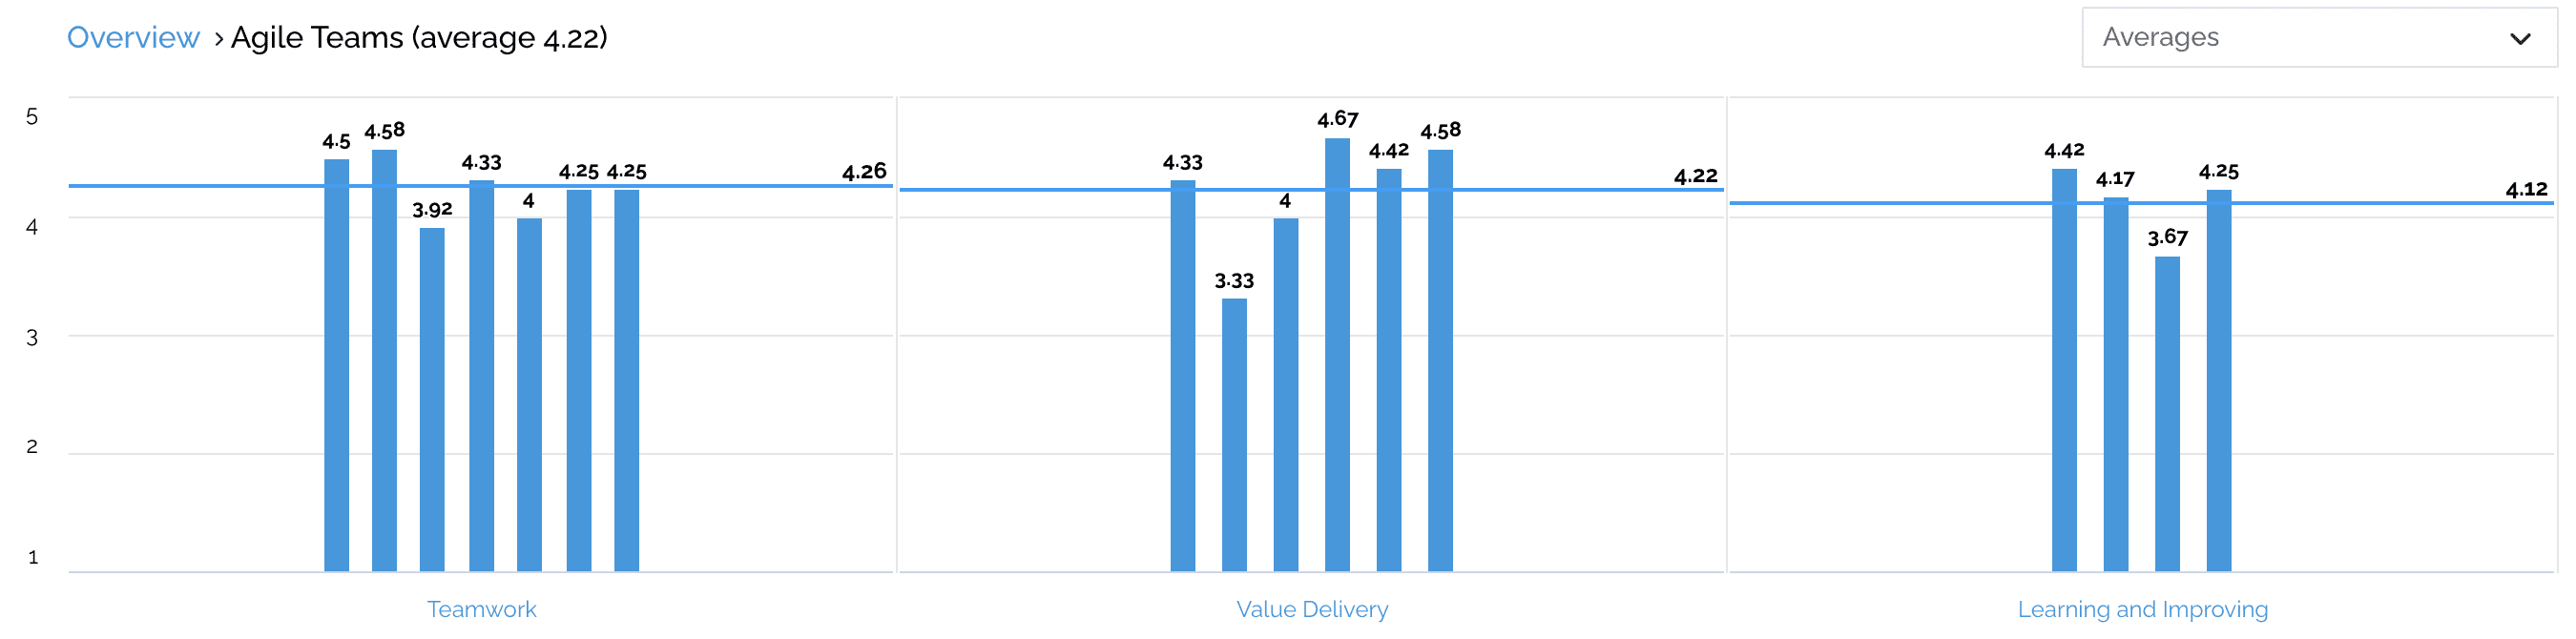
Once the assessment is complete, the team receives the results broken down by each category of team and technical agility.
When you click on a category, the results break into three sub-categories to drill down even further into the responses.
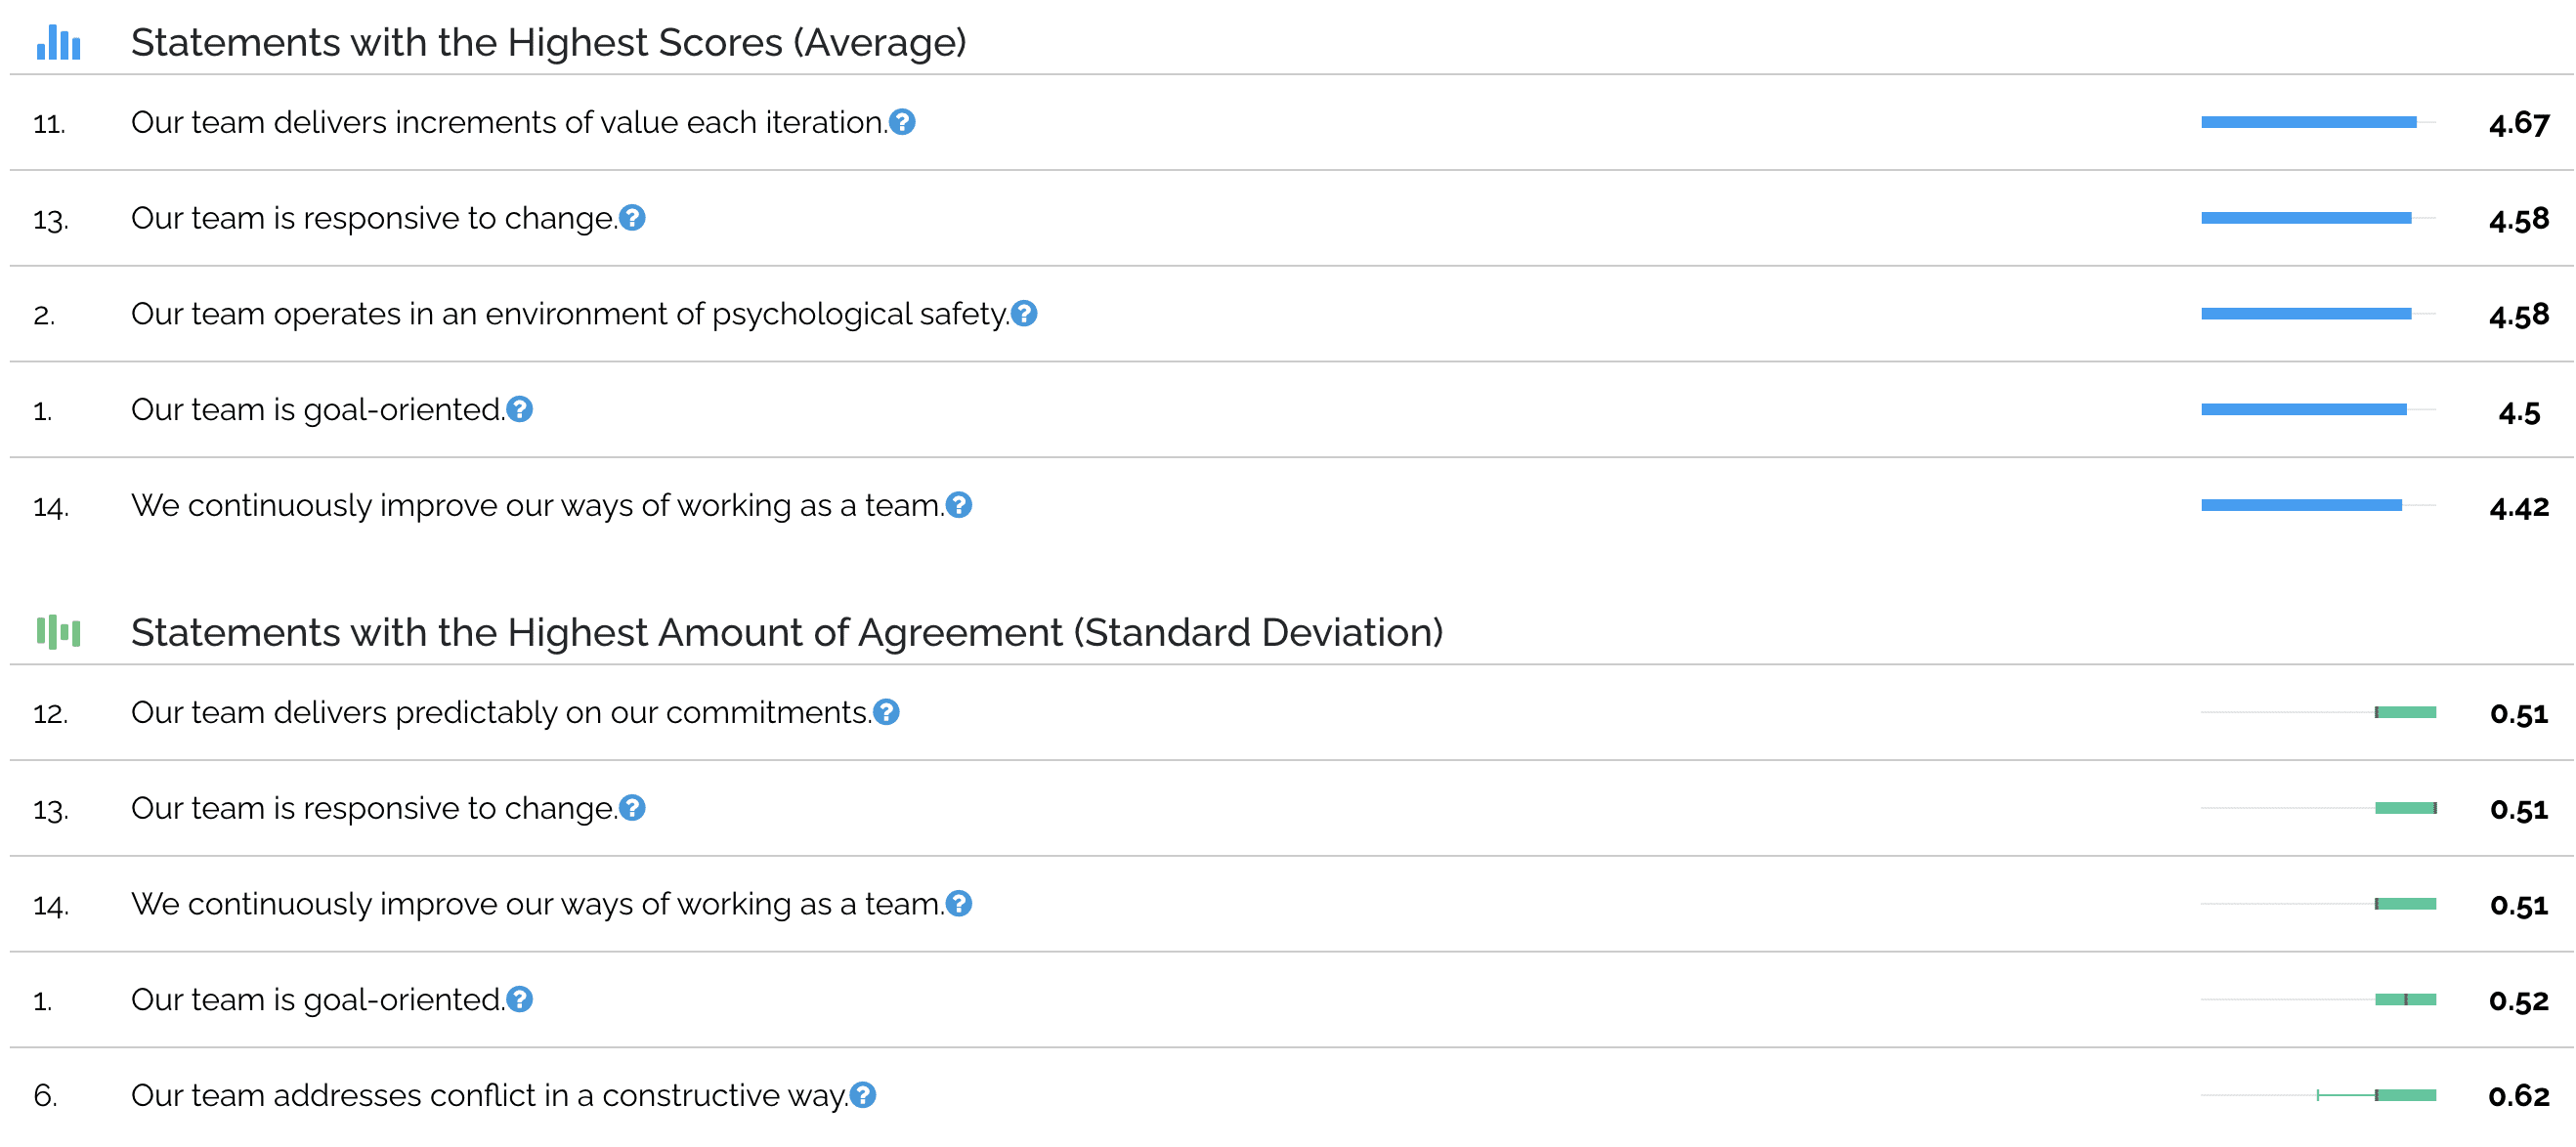
In addition to the responses, you receive key strengths. The answers with the highest average scores and the lowest deviations between team members are key strengths.
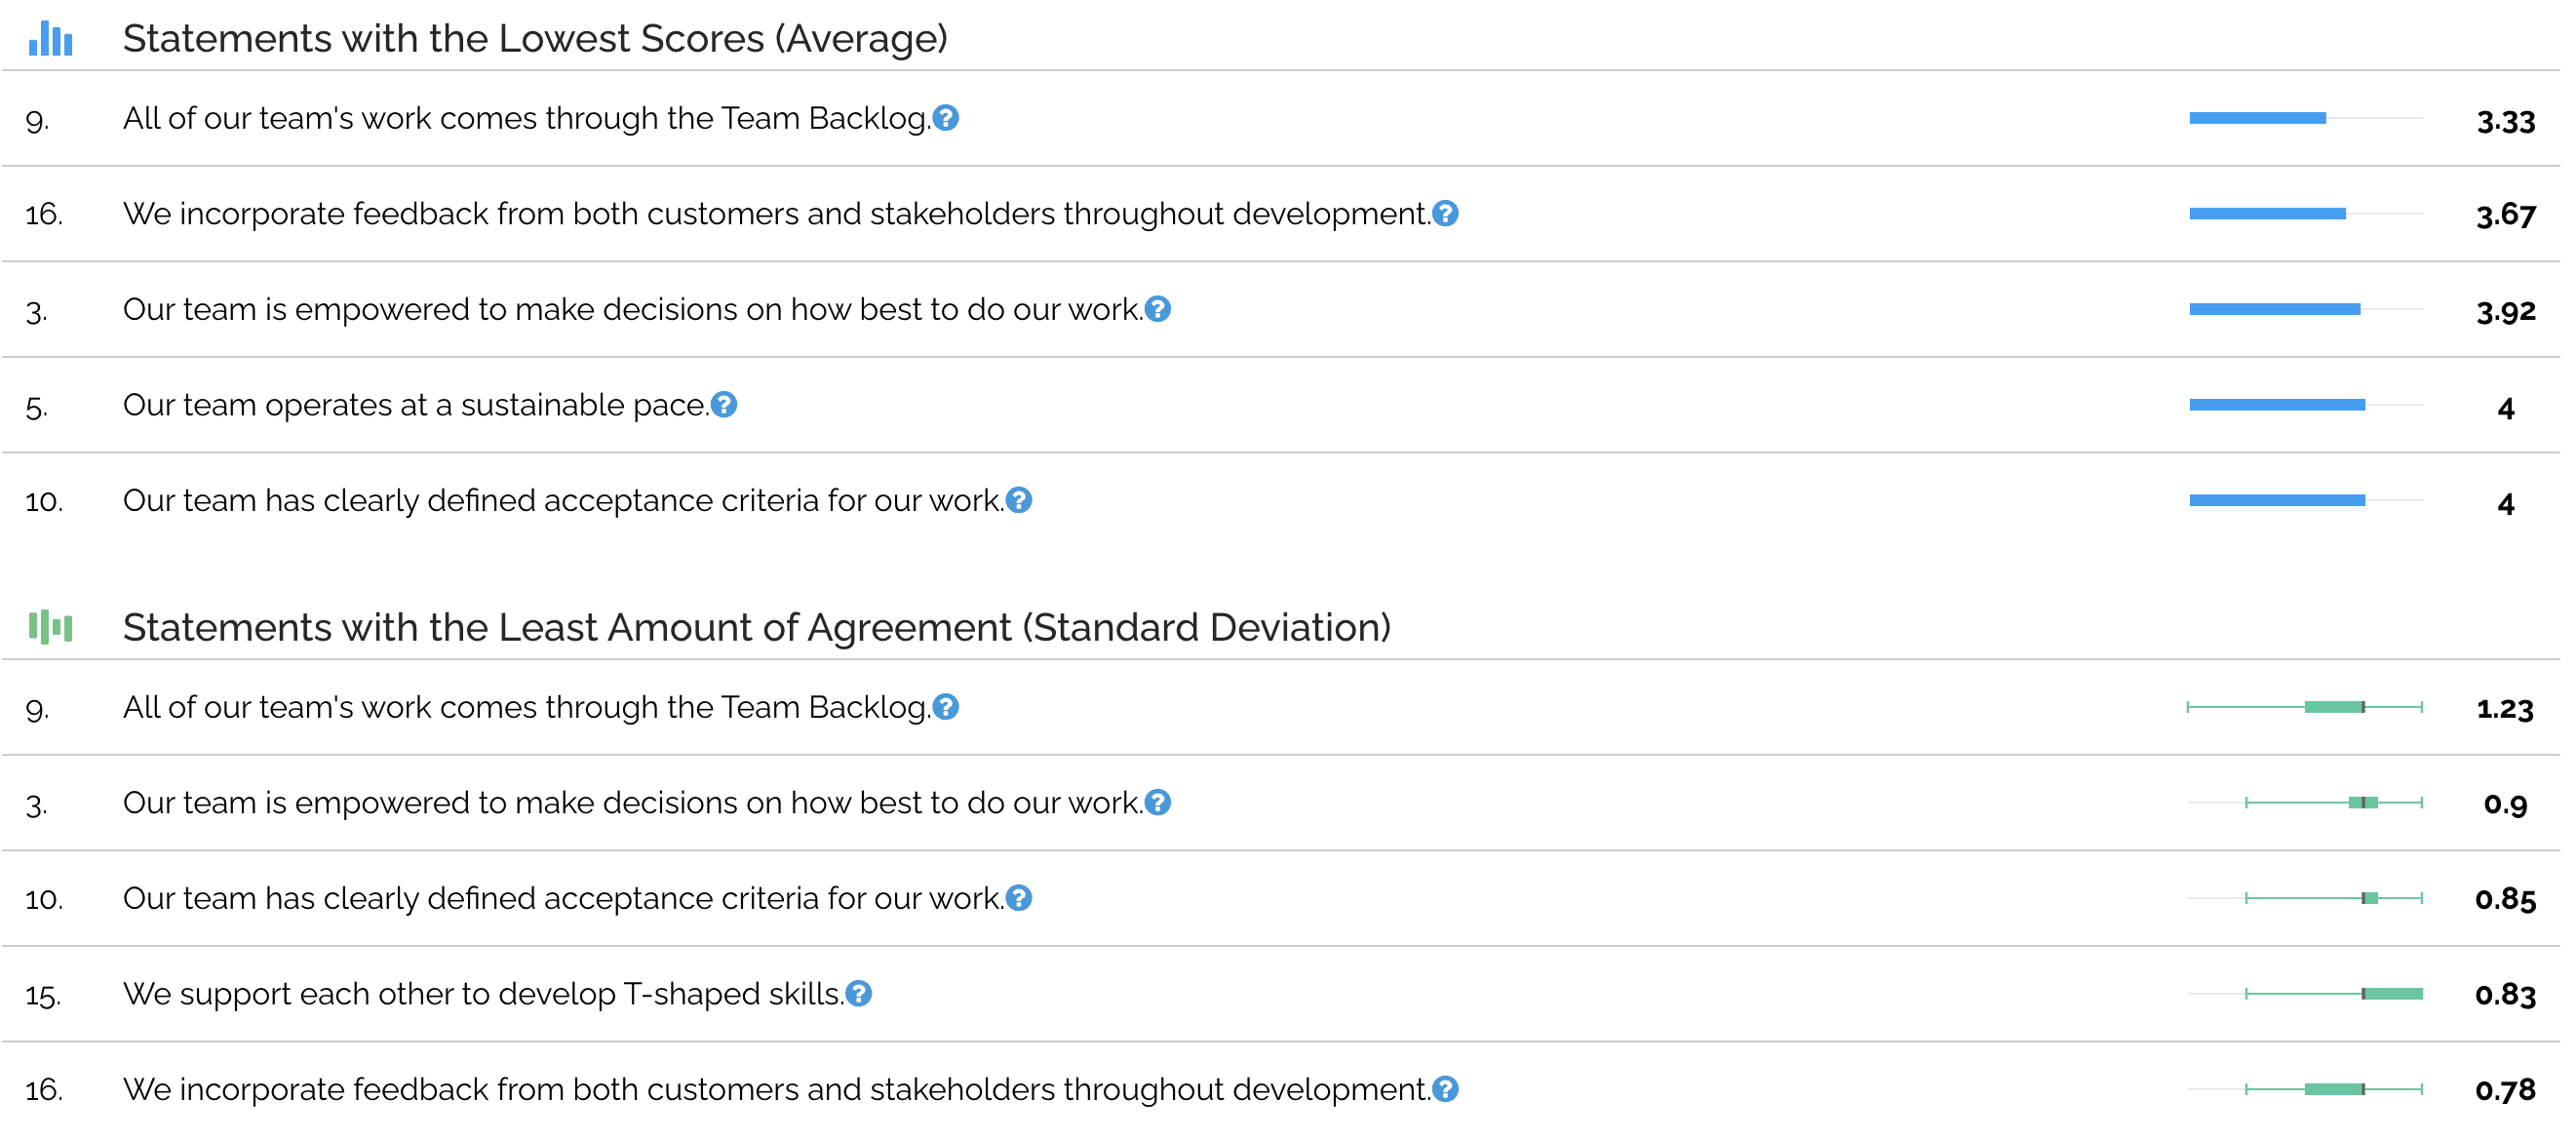
Inversely, you also get key opportunities. The answers with the lowest average scores and highest deviations between team members highlight areas where more focus is needed.
The assessment will include growth recommendations based on your team’s results. These are suggested next steps for your team to improve the statements and areas where it scored lowest.
How do I access the team and technical agility assessment?
You can access the team and technical agility assessment in SAFe® Studio. Use the following steps:
Log into SAFe® Studio.
Navigate to the My SAFe Assessments page under “Practice” in the main navigation bar on the left side of the homepage.
Click the Learn More button under Comparative Agility, our Measure and Grow Partner. The team and technical agility assessment runs through their platform.
Click on the Click Here to Get Started button.
From there, you’ll land on the Comparative Agility website. If you want to create an account to save your progress and assessment data, you may do so. If you’d like to skip to the assessment, click on Start Survey in the bottom right of the screen.
Select Team and Technical Agility Assessment.
Click Continue in the pop-up that appears.
The assessment will then start in a new tab.
See each of these steps in action in this video.
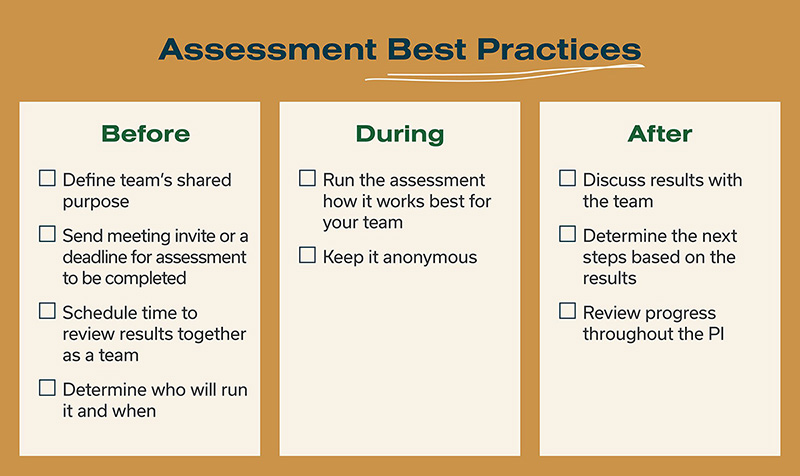
Team and Technical Agility Assessment Best Practices
To ensure you get the best results from the team and technical agility assessment, we’ve compiled recommended actions before, during, and after the assessment.
Before facilitating the team and technical agility assessment
Being intentional about how you set up the assessment with your team will give you results you can work with after the assessment.
Who should run the assessment
Running assessments can be tricky for a few reasons.
Teams might feel defensive about being “measured”
Self-reported data isn’t always objective or accurate
Emotions and framing can impact the results
That’s why SAFe recommends a SM/TC or other trained facilitator run the assessment. A SM/TC, SPC, or Agile coach can help ensure teams understand their performance and know where to focus their improvement efforts.
When to run the assessment
It’s never too early or too late to know where you stand. Running the assessment for your team when starting with an Agile transformation will help you target the areas where you most need to improve, but you can assess team performance anytime.
As for how frequently you should run it, it’s probably more valuable to do it on a cadence—either once a PI or once a year, depending on the team’s goals and interests. There’s a lot of motivation in seeing how you grow and progress as a team, and it’s easier to celebrate wins demonstrated through documented change over time.
How to prepare to run the assessment
Before you start the team and technical agility assessment, define your team’s shared purpose. This will help you generate buy-in and excitement. If the team feels like they’re just completing the assessment because the SM/TC said so, it won’t be successful. They must see value in it for them as individuals and as a team.
Some questions we like to ask to set this purpose include:
What do we want it to feel like to be part of this team two PIs from now?
How will our work lives be improved when we check in one year from now?
We like to kick off the assessment with a meeting invitation with a draft agenda if you’re completing the assessment as a team. Sending this ahead of time gives everyone a chance to prepare. You can keep the agenda loose, so you have the flexibility to spend more or less time discussing particular areas, depending on how your team chooses to engage with each question.
If you’re completing the assessment asynchronously, send out a deadline of when team members must complete the assessment by. Then send a meeting invitation for reviewing the results as a team.
Facilitating the team and technical agility assessment
Now it’s time to complete the assessment. These are a couple of tips to consider when facilitating the assessment for your team.
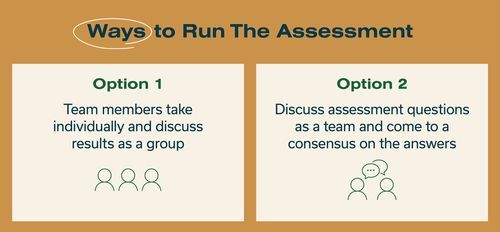
Running the assessment
There are two ways you can approach running this assessment. Each has a different value. Choose the option based on your team’s culture.
Option one is to have team members take the assessment individually and then discuss the results as a group. You can do this one of two ways: team members complete the assessment asynchronously by a certain date so you can review results as a team later or set a time for teammates to take the assessment at the same time and discuss results immediately afterwards.
Option two is to discuss the assessment questions as a team and agree on the group’s answers.
When we ran this assessment, we had team members do it individually so we could focus our time together on reviews and actions. If you run it asynchronously, be available to team members if they have questions before you review your answers.
Keeping the assessment anonymous
Keeping the answers anonymous is helpful if you want more accurate results. We like to be clear upfront that the assessment will be anonymous so that team members can feel confident about being honest in their answers.
For example, with our teams, we not only explained the confidentiality of individuals’ answers but also demonstrated in real time how the tool works so that the process would feel open and transparent. We also clarified that we would not be using the data to compare teams to each other or for any purpose other than to gain a shared understanding of where we are selecting improvement items based on the team’s stated goals.
However, if you choose to complete the assessment as a team and decide on each answer together, answering anonymously isn’t possible. Choose the option you think works best for your team’s culture.
After facilitating the team and technical agility assessment
The main point of running the team and technical agility assessment is to get the information it provides. What you do with this information determines its impact on your team.
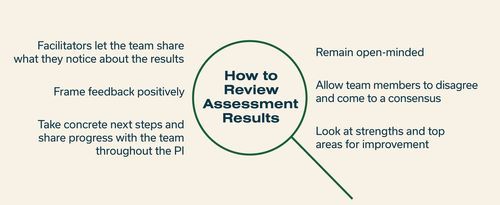
What to do with the assessment results
Once you’ve completed the assessment using one of the two approaches,
Review sections individually
Show aggregate results
Allow team to notice top strengths and areas for improvement
Don’t tell the team what you think as facilitator
We learned in the assessment how much we disagreed on some items. For example, even with a statement as simple as “Teams execute standard iteration events,” some team members scored us a five (out of five) while others scored us a one.
We treated every score as valid and sought to understand why some team members scored high and others low, just like we do when estimating the size of a user story.
This discussion lead to:
Knowing where to improve
Uncovering different perspectives
Showing how we were doing as a team
Prompting rich conversations
Encouraging meaningful progress
We know it can be challenging to give and receive feedback, especially when the feedback focuses on improving. Here are a few ways to make conversations about the assessment results productive with your team.
Using the assessment to improve
With your assessment results in hand, it’s time to take actions that help you improve.
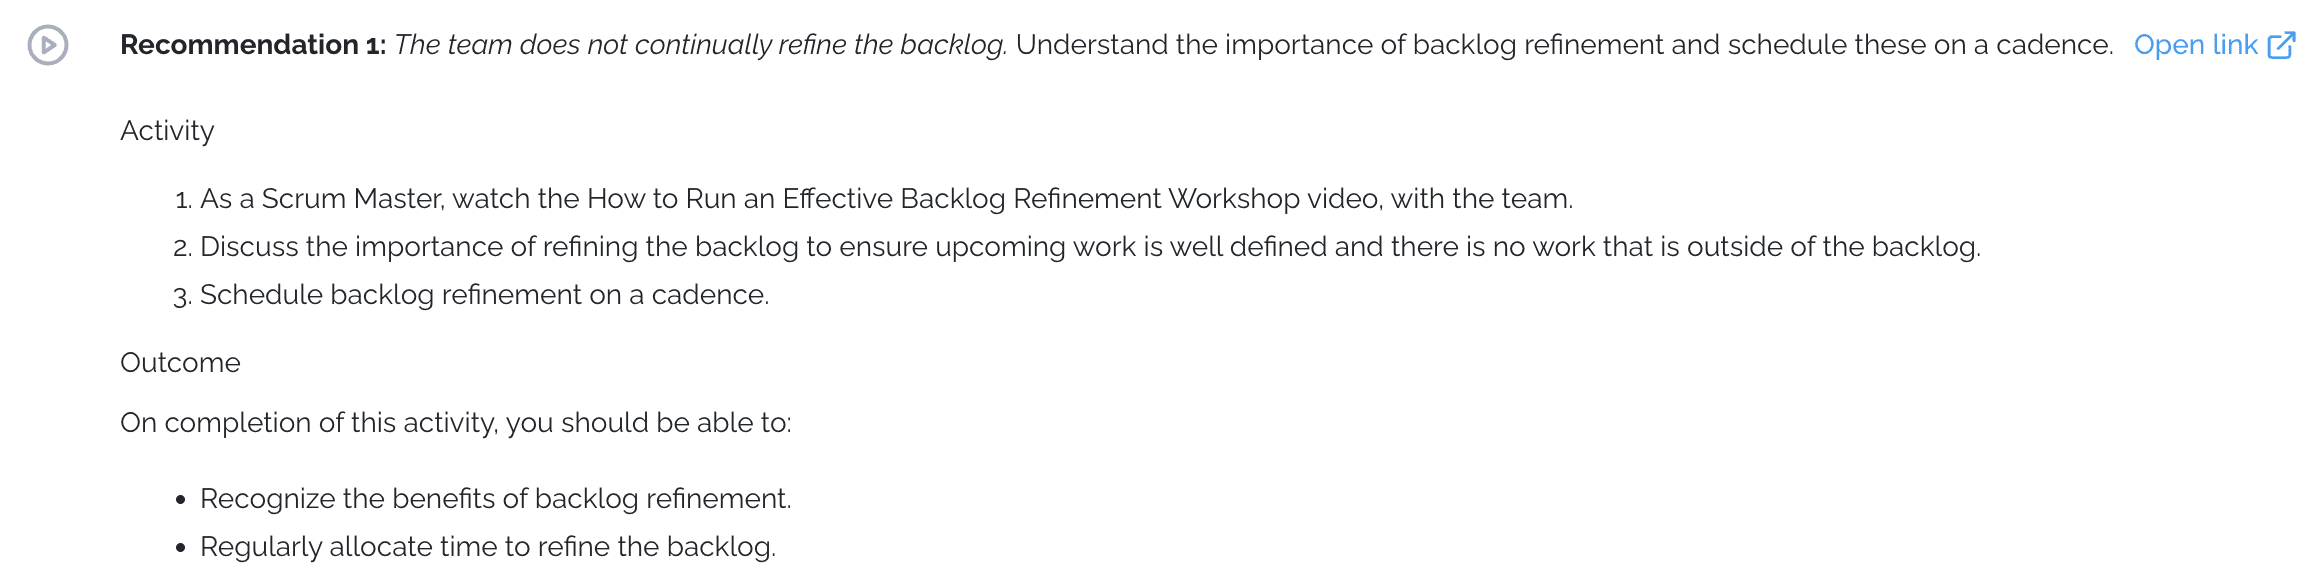
For each dimension of the team and technical agility assessment, SAFe provides growth recommendations to help teams focus on the areas that matter most and prioritize their next steps.
Growth recommendations are helpful because they’re bite-sized actions to break down the overall area of improvement. They’re easy to fit into the PI without overloading capacity.
Examples of growth recommendations:
Example 1:
As a SM/TC, watch the How to Run an Effective Backlog Refinement Workshop video with the team.
Discuss the importance of refining the backlog to ensure upcoming work is well-defined and there is no work outside the backlog.
Schedule backlog refinement on a cadence.
Example 2:
As a team, use the Identifying Key Stakeholders Collaborate template and answer the following questions:
Who is the customer of our work? (This could be internal or external customers.)
Who is affected by our work?
Who provides key inputs or influences the goals of our work?
Whose feedback do we need to progress the work?
Maintain a list of key stakeholders.
Example 3:
As a team, collect metrics to understand the current situation. Include the total number of tests, the frequency each test is run, test coverage, the time required to build the Solution and execute the tests, the percentage of automated tests, and the number of defects. Additionally, quantify the manual testing effort each Iteration and during a significant new release.
Present and discuss these metrics with the key stakeholders, highlighting how the lack of automation impacts quality and time to market.
Create a plan for increasing the amount of test automation.
Here are some actions you should take once you’ve completed the assessment:
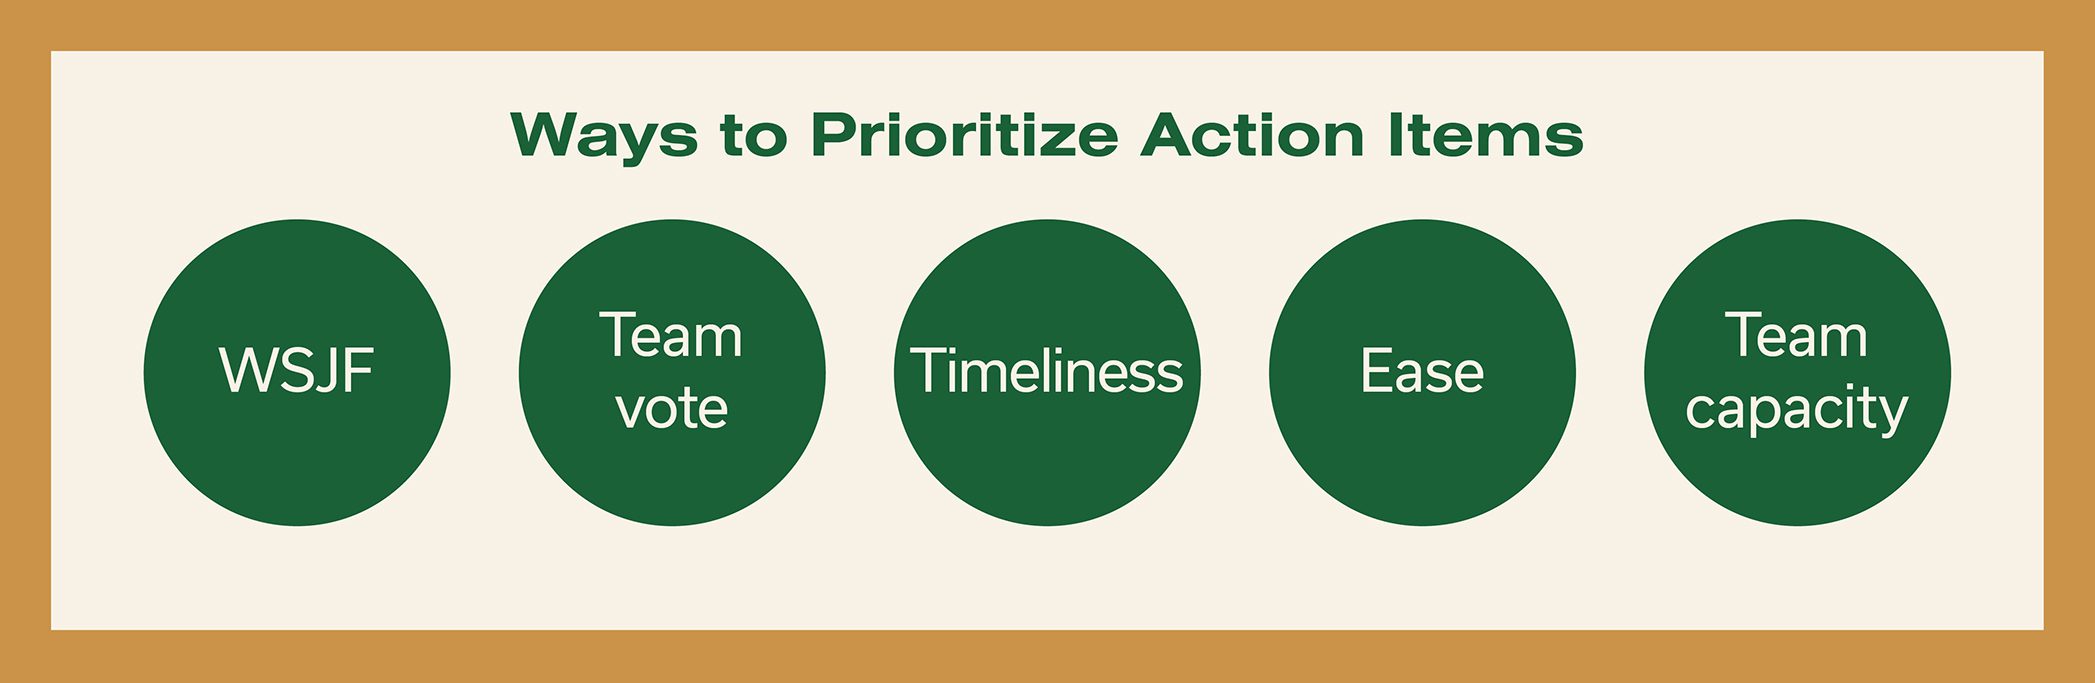
Review the team growth recommendations together to generate ideas
Select your preferred actions (you can use dot voting or WSJF calculations for this; SAFe® Studio has ready-made templates you can use)
Capture your team’s next steps in writing: “Our team decided to do X, Y, and Z.”
Follow through on your actions so that you’re connecting them to the desired outcome
Review your progress at the beginning of iteration retrospectives
Finally, you’ll want to use these actions to set a focus for the team throughout the PI. Then check in with Business Owners at PI planning on how these improvements have helped the organization progress toward its goals.
Tip: Simultaneously addressing all focus areas may be tempting, but you want to limit your WIP.
To do this, pick one focus area based on the results. You can add the remaining focus areas to the backlog to begin working on once you’ve addressed the first one.
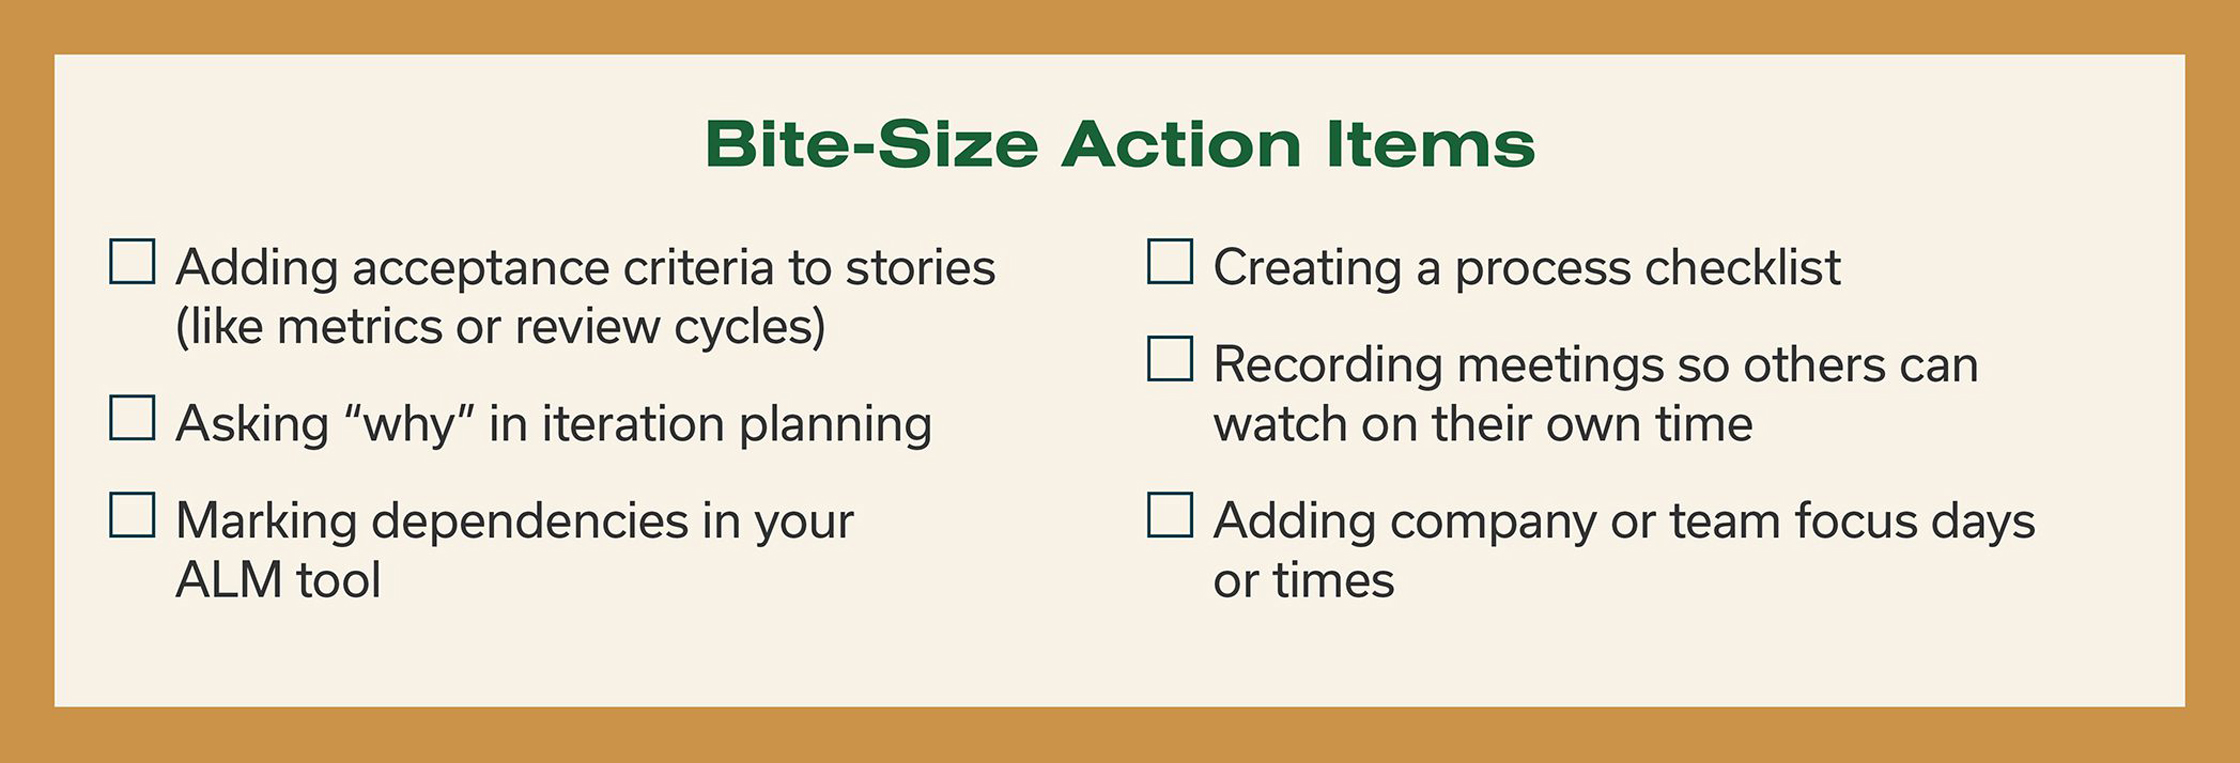
Feeling overwhelmed by the action items for your team? Try breaking them down into bite-size tasks to make it easier on capacity while still making progress.
These are some examples.
Team and Technical Agility Assessment Resources
Here are some additional resources to consider when assessing your team’s agility.
Lieschen Gargano is a Release Train Engineer and conflict guru, thanks in part to her master’s degree in conflict resolution. As the RTE for the development value stream at Scaled Agile, Inc., Lieschen loves cultivating new ideas and approaches to Agile to keep things fresh and engaging. She also has a passion for developing practices for happy teams of teams across the full business value stream.
Sam is a certified SAFe® 6 Practice Consultant (SPC) and serves as the SM/TC for several teams at Scaled Agile. His recent career highlights include entertaining the crowd as the co-host of the 2019, 2020, and 2021 Global SAFe® Summits. A native of Columbia, South Carolina, Sam lives in Kailua, Hawaii, where he enjoys CrossFit and Olympic weightlifting.
Discover SAFe® 6.0 – The Next Evolution with Dean Leffingwell
Here at Scaled Agile, we were thrilled to announce the launch of SAFe® 6.0 and SAFe Studio this month. These new updates will deepen SAFe’s impact, help you build resiliency and reshape the way you approach transformation. On 30 March, Dean Leffingwell is joining us for a deep dive into what these changes mean for you in the APAC region.
When:
March 30, 2023, 11:12 am – March 30, 2023, 11:25 am
The Scaled Agile APAC team is thrilled to host our Co-founder and Cheif Methodologist, Dean Leffingwell, to share his insights about SAFe 6.0. Learn directly from Dean about how these updates enable you to work differently and build the future.
11:30 am AEDT 6:00am IST 8:30am SGT 8:30am CST 9:30am JST
Recognized as one of the world’s foremost authorities on Lean-Agile best practices, Dean Leffingwell is an entrepreneur and software development methodologist best known for creating SAFe®, the world’s most widely used framework for business agility.
His best-selling books, Agile Software Requirements, Scaling Software Agility, and SAFe® Distilled, form much of the basis of modern thinking on Lean-Agile practices and principles. Founder of several successful startups, including Requisite, Inc. (acquired by Rational), Mr. Leffingwell also served as Chief Methodologist to Rally Software, and prior to that, as Sr. Vice President at Rational Software (now part of IBM). He currently serves as Chief Methodologist to Scaled Agile, Inc., which he co-founded in 2011.
This one-day workshop will provide an overview of SAFe’s comprehensive measurement model and explore how it can be applied across teams, ARTs, and portfolios. Attendees will have the opportunity to consider their own context and design a balanced metrics dashboard to support improvement at all enterprise levels.
The workshop supports everyone involved with building solutions with SAFe®. This may include, but is not limited to, the following:
Cross-functional members of Agile Teams, Agile Release Trains, or Solution Trains running for one PI or longer
A SAFe Portfolio that has already identified its value streams and begun implementing LPM
Full Agile Teams across multiple value streams within a single Portfolio
What attendees will learn
The flow tools and coaching available to them
Current usage of SAFe Flow Metrics within their organization
How each of the SAFe Flow Accelerators applies within their organization
How to align on actions and create a flow-based improvement backlog
How improvement items affect the larger flow of the value stream or Portfolio
Prerequisites
This workshop is designed to support a set of cross- functional attendees from value stream(s) applying SAFe for at least one PI.
What’s included
Workshop materials
Eight hours of facilitation from a SAFe Strategic Advisor or SAFe Fellow
Three hours of prep time with internal SPCs or leaders
Speakers
Odile Moreau
SAFe® Strategic Advisor and SPCT (Scaled Agile Inc.)
Odile is a SAFe® strategic advisor and SPCT for Scaled Agile Inc. She guides international organisations through adoption of business agility. By combining deep matter expertise with the ability to coach on behaviour and leadership, she has been a highly effective team coach for large organisations. Odile is passionate about Lean Kanban, Scrum, Lean and SAFe, never losing sight of the human factor. With 20+ years of professional experience helping profit and non-profit organisations in the fields of IT Service Management, Business Information Management and Software Engineering across the world, Odile worked for many profit and non-profits making organisations in Europe. The last 10 years her focus has been helping teams adopt the agile mindset, principles and practices at scale and continuous improvement methods.
Andrew has been supporting organizations with their Agile transformation for more than 10 years, drawing on his experiences from software development, project management, and product management. He previously led the Agile Services Practice across EMEA for CA Technologies (formerly Rally) and is a regular speaker at Agile conferences and contributor to the Agile community.
This one-day workshop will provide an overview of SAFe’s comprehensive measurement model and explore how it can be applied across teams, ARTs, and portfolios. Attendees will have the opportunity to consider their own context and design a balanced metrics dashboard to support improvement at all enterprise levels.
When:
April 20, 2023, 9:00 am – April 20, 2023, 5:00 pm MST
The workshop supports everyone involved with building solutions with SAFe®. This may include, but is not limited to, the following:
Cross-functional members of Agile Teams, Agile Release Trains, or Solution Trains running for one PI or longer
A SAFe Portfolio that has already identified its value streams and begun implementing LPM
Full Agile Teams across multiple value streams within a single Portfolio
What attendees will learn
The flow tools and coaching available to them
Current usage of SAFe Flow Metrics within their organization
How each of the SAFe Flow Accelerators applies within their organization
How to align on actions and create a flow-based improvement backlog
How improvement items affect the larger flow of the value stream or Portfolio
Prerequisites
This workshop is designed to support a set of cross- functional attendees from value stream(s) applying SAFe for at least one PI.
What’s included
Workshop materials
Eight hours of facilitation from a SAFe Strategic Advisor or SAFe Fellow
Three hours of prep time with internal SPCs or leaders
Speakers
Rosana (Ro) Johnson
Strategic Advisor (Scaled Agile, Inc.)
Rosana has twenty-five years of experience and is a successful result driven leader. She has an extensive background in transforming people, systems, tools and processes. Her expertise ranges from creating deliverables for complex tooling deployments to transforming teams to agile ways of working to drive productivity while delivering a solid customer/employee experience by accelerating time to market and ensuring quality and business agility. Rosana’s strength is mentoring client leadership teams in changing their language, influencing new habits, and ultimately shifting mindsets. She is known for being the “glue” that unites collaboration between business needs and IT solution
Firstname Lastname
SPCT, Strategic Advisor (Scaled Agile, Inc.)
Jim has worked with many notable enterprises and government agencies such as Microsoft, Mercedes, Emerson, GM, and NASA assisting the Supply Chain Engineering and other groups, helping them define, implement, evangelize, and train the organisations in a new operating model based on the SAFe framework. While at Microsoft Jim helped to form a team of top notch coaches, acted as an adviser to the leadership teams of the organizations, helped form transformation plans, trained more than 1,000 team members, coached teams to improve their agile maturity, and customized Azure DevOps/VSTS to support the SAFe structure for work tracking and reporting.
Measure What Matters in Business Agility Workshops
This one-day workshop will provide an overview of this comprehensive measurement model and explore how it can be applied across teams, ARTs, and portfolios.
When:
March 8, 2023, 9:00 am – March 8, 2023, 5:00 pm MST
Business Agility sets new performance standards for organizations, requiring fast, effective responses to emerging opportunities. This changes what we measure, how we measure, and how we use the data to support key decision-making. Measurement becomes a critical enabler of continuous business performance improvement.
Learning Objectives
At the end of this workshop attendees should be able to:
Explain the three measurement domains that help organizations measure and grow toward Business Agility
Describe how KPIs and OKRs are used to define measurable outcomes
Apply the SAFe assessments to measure competency
Select appropriate flow metrics for each level of the framework
Identify a key set of metrics that support improved decision-making in your Enterprise
Speakers
Jim Fowler
SPCT and Strategic Advisor (Scaled Agile, Inc.)
Jim has worked with many notable enterprises and government agencies such as Microsoft, Mercedes, Emerson, GM, and NASA assisting the Supply Chain Engineering and other groups, helping them define, implement, evangelize, and train the organisations in a new operating model based on the SAFe framework. While at Microsoft Jim helped to form a team of top notch coaches, acted as an adviser to the leadership teams of the organizations, helped form transformation plans, trained more than 1,000 team members, coached teams to improve their agile maturity, and customized Azure DevOps/VSTS to support the SAFe structure for work tracking and reporting.
Andrew has been supporting organizations with their Agile transformation for more than 10 years, drawing on his experiences from software development, project management, and product management. He previously led the Agile Services Practice across EMEA for CA Technologies (formerly Rally) and is a regular speaker at Agile conferences and contributor to the Agile community.
This one-day event, hosted by Scaled Agile at the Ronald Reagan Building, will explore the challenges agencies face in implementing Agile acquisitions within the unique constraints of the US Government.
When:
April 11, 2023, 9:00 am – April 11, 2023, 5:00 pm EST
Where:
Ronald Reagan Building – 1300 Pennsylvania Avenue NW, Washington, DC 20004
Who:
Agile Coach, Consultant, Director, SAFe Program Consultant
This year’s conference focuses on developing Agile Leadership skills for an Agile (SAFe) transformation. The conference will provide insight and ideas around common United States Government staff concerns such as Agile contracting, measuring an Agile acquisition, and strategies to build an agile workforce.
Prior to the conference, there will be a one-day workshop on April 10th. You can attend one or both days based on the pass you purchase. Group discounts are available for teams with five or more attendees.
Speakers
Check back as we confirm additional speakers.
Dr. Steve Mayner
SAFe Fellow and Principal Consultant (Scaled Agile Inc.)
Expert thought leader, speaker, coach, consultant, and trainer in the principles and practices of agility at an enterprise level. Extensive experience building positive relationships with C-Level executives and management teams, translating business goals and objectives into initiatives that provide IT capabilities in support of organizational investment themes. Strong background in both Federal and commercial organizations.
We started this series on SAFe® team metrics with the simple acknowledgment that contextualizing SAFe metrics for a non-technical Agile team can be difficult. To continue learning how other teams adapt SAFe metrics to their specific context, I sat down with Amber Lillestolen, the Scrum Master of the Corporate Communications (Comms) team at Scaled Agile, Inc. Here’s what she shared about applying SAFe metrics for a ‘traditional’ communications team.
Applying SAFe® Metrics in Marketing for a Communications Team
Scaled Agile has a few small cross-functional marketing teams to support different business areas. Corporate Comms is one of these small teams. Their purpose is to propel market growth through a cohesive, compelling brand experience that inspires delight, confidence, and loyalty in current and prospective customers.
The team works across the company—from public relations to customer stories and brand work for new product launches. Rather than debugging and deploying, communications professionals help simplify and communicate complex messaging, refine product value propositions, develop thought leadership content, and much more. This work requires significant cross-functional skill, research capabilities, collaboration, qualitative reasoning, and the ability to build alignment while planning for future releases.
Their common work items include
Company-wide brand reviews
Auditing and updating brand guidelines
Market research
Developing product messaging and value propositions
Understanding customer needs and building messaging frameworks with other marketing teams
Thought leadership content development with executives
Public relations strategy and management
Material preparation for events and conferences
Recruiting and curating event customer stories
Naming and messaging standardization across the organization
Amber is Corporate Comms’ first Scrum Master, about four months into serving the team. Corporate Comms is a unique team because they are a shared service across the organization. This means they receive a significant amount of walk-up work from other teams. Since this type of work consistently (though not always predictably) consumes a portion of the team’s capacity, it’s important to track it using metrics.
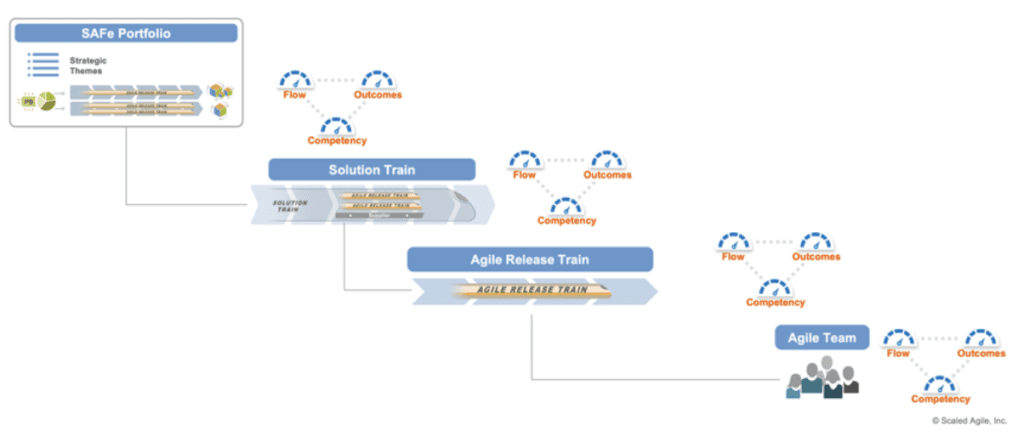
Below, Amber shares her process for tracking the team’s performance, including which metrics she uses to coach and guide the team. We separated these team metrics into the three measurement domains outlined in the metrics article: outcomes, flow, and competency.
Outcomes
Question: What metrics do you use to measure outcomes?
Outcome metric #1: PI Objectives
The Corporate Comms team reviews PI objectives throughout the PI to ensure that their related features are progressing. This helps the team determine if they are ahead, on track, or behind on the outcomes they promised to deliver in the PI.
Here’s a basic example of a Corporate Comms PI objective:
In support of SAFe’s evolving brand, provide enablement resources for applying new communication messaging and naming to team-level assets.
Outcome metric #2: Iteration Goals
The team creates goals every iteration and tracks their progress. They create goals related to the high-priority stories planned for the iteration.
Flow
Question: What metrics do you use to measure flow?
PI objectives
For Amber, flow is about delivering value, so she also included PI objectives under the flow metrics category. The Corporate Comms team uses PI objectives to measure its flow as part of the Operations Agile Release Train (ART). She reviews the team’s objectives during iterations to help the team understand what value they’re bringing to the organization.
If you don’t remember seeing PI objectives in the flow section of the SAFe Metrics article, you’re right. flow metrics, like predictability, show how well teams achieve outcomes like a PI Objective.
But for the Corporate Comms team, tracking the degree to which an objective is completed functions as a handy ‘pseudo-flow’ metric for the comms team. Ultimately, their PI objectives will roll up into broader Program Predictability Measurements, but this is a good way to track flow predictability on a smaller scale at the team level.
This is a good example of adapting metrics to meet their team needs, and simplifying their measurement process to retain its simplicity and usability. If objectives are continually missed over several PIs, this means value isn’t flowing. And value flow is the purpose of flow metrics.
Amber combines PI Objective progress with a review of the team’s velocity to understand the flow of value and completed work each iteration.
Flow Distribution and Flow Velocity
Flow distribution measures the amount of work type in a system over time, which is important for the Corporate Comms team to track.
As mentioned above, Corporate Comms is a shared services team. This means the entire organization is an internal customer of their work. As a result, the team has frequent walk-up work from other groups. Some examples of the team’s walk-up work include:
Booth designs for domestic and international events
Market research and analysis when a change occurs
Reviewing other teams’ slide decks and presentation materials
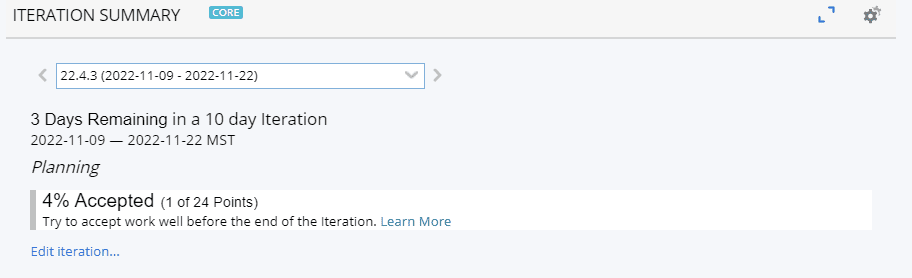
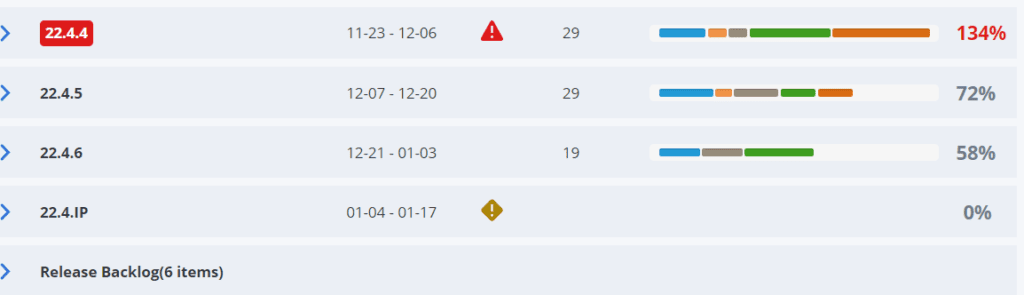
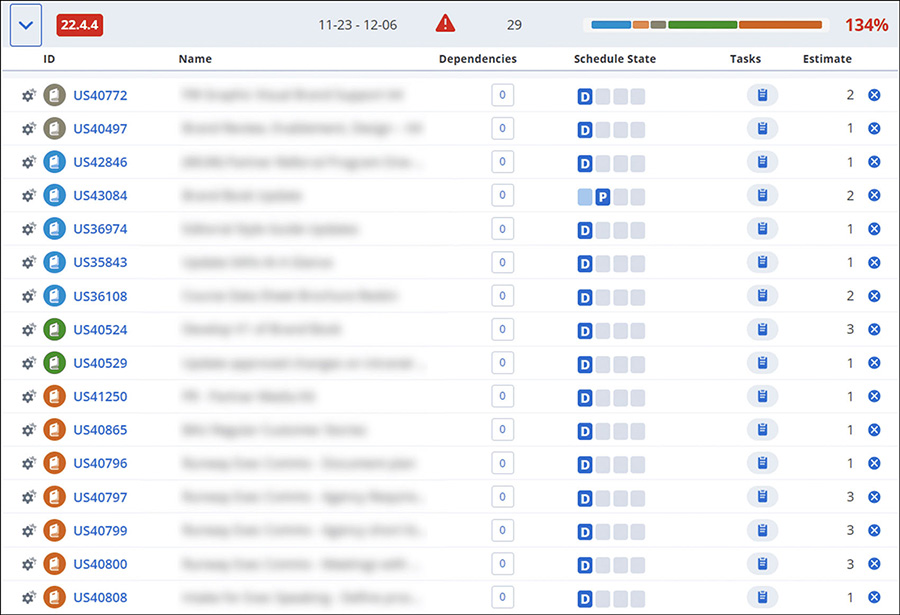
Because this walk-up work is a regular occurrence for the team, they reserve some of their capacity for it each iteration. It’s important for the team to see how their work is distributed across planned and unplanned work so they know how much capacity on average to reserve for walk-up work each iteration. They track their capacity in an ALM tool using the following views:
Iteration Summary view in ALM tool
Team Planning view in ALM tool
Team planning view in ALM tool (work items blurred for confidentiality)
The team looks at their capacity and velocity metrics during iteration planning to see if they are over capacity.
Flow velocity measures the number of backlog items completed over a period of time; in Corporate Comms’ case, this period of time is an iteration.
They review these metrics at iteration review to see if they finished all planned work. Amber also uses the team planning board in an ALM tool to show if the team is over capacity and discuss what items need to move at iteration planning to adjust their capacity.
Using capacity metrics to move stories
If the team discovers they’re over capacity, it’s usually for one of two reasons:
1) Long review cycles
2) Undefined work
A lot of the team’s work is tied to cross-functional changes across the business, and those carry unknowns. As strategy evolves, sometimes the work changes to match what’s new.
Marketing teams are prone to getting buried in last minute requests and repeated context switching. SAFe provides a shared language and approach to work that teams can use to define:
What work can be done
How long that work will take
Dependencies
What other work needs to move or change to accommodate priority requests
This is a helpful level-set on expectations for how other teams can protect the time and resources needed to deliver planned value.
Reserving capacity for walk-up work
Amber also tracks the work that comes in and the team adds stories for walk-up work. They use this data to measure unplanned work requests during the PI compared to the work planned during PI Planning.
During the last PI, which was the team’s first PI Planning with a Scrum Master, Amber encouraged the team to plan to only 80 percent capacity to allow for any walk-up work. She arrived at this number based on the 20 percent of walk-up work from previous capacity and velocity metrics.
The team also uses ‘bucket’ user stories every iteration for team members who run office hours and complete other routine work. Office hours are blocks of time reserved for people from other teams in the organization to bring items to Corporate Comms for review. These brand office hours occur three times a week for an hour.
Any work brought to office hours that will take over two hours becomes a story with points and is added to the iteration based on urgency and capacity. Tracking their work this way creates a reliable record of capacity needed to address business as usual items, planned new work each iteration, and walk up requests.
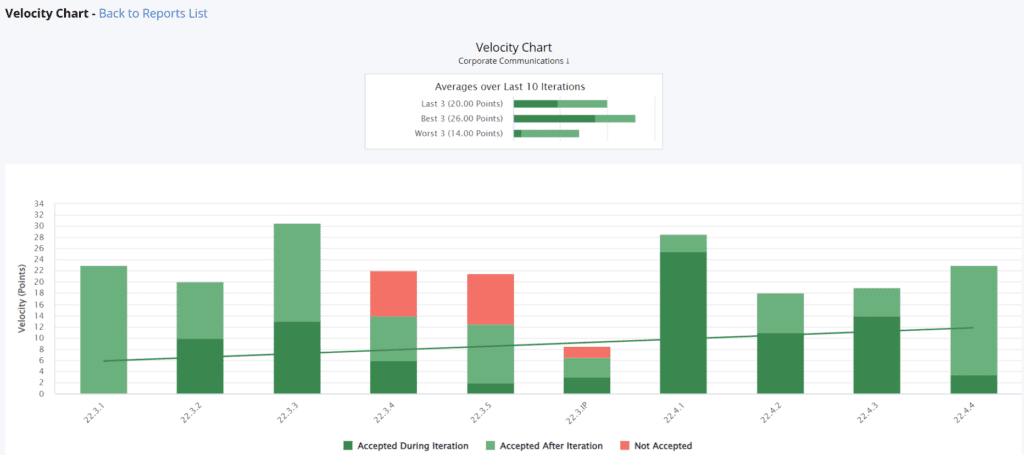
Velocity Chart and Cycle/Lead Time
As the Corporate Comms team grows, Amber wants to track the team’s flow better and share more data with the team during Iteration reviews. Specifically, she plans to use the velocity chart to see how the team’s velocity changes throughout each iteration:
Velocity chart
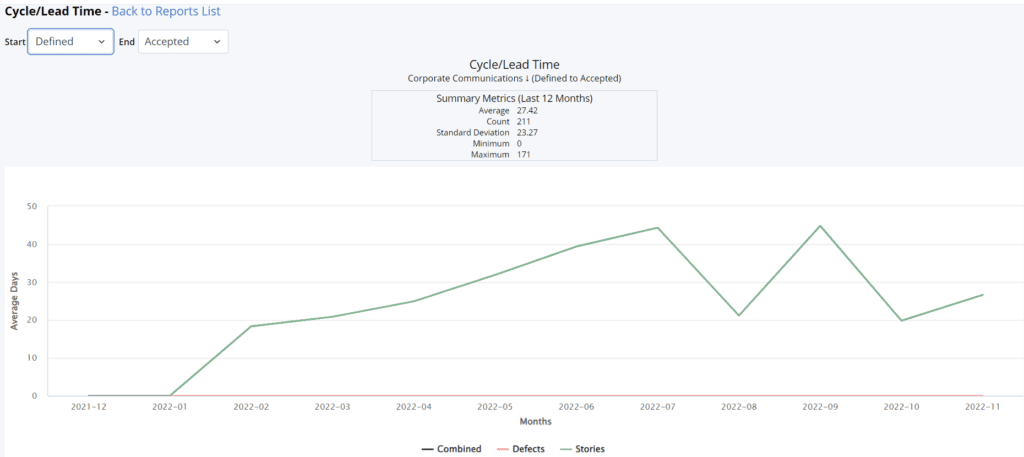
She also plans to use the cycle/lead time report to see how long it takes the team’s work to flow through the iterations.
Cycle/lead time report
Because dependencies impact the speed at which the team can do their work, Amber would like to start tracking how dependencies impact the team’s flow. Currently, the team uses daily standups and retrospectives to discuss work going through the kanban and when things don’t get finished in an iteration.
Competency
The Corporate Comms team recently completed a Team and Technical Agility assessment.
Amber is reviewing the organization-wide results with the LACE team and discussing how to analyze the results to determine next steps. But she has shared initial results with her team. Corporate Comms identified growths and strengths based on their results and retrospectives.
Growth area
They need to continue to work on their capacity/velocity to help their flow.
Strength area
They are great at collaboration and peer review as a team.
Team formation
Since their formation less than a year ago, the Corporate Comms team has learned a lot about how to work as a shared service for the whole company. They’ve created new outlets of communication and coordination to increase the value they can deliver.
About Amber Lillestolen
Amber is a Scrum Master at Scaled Agile. For years, she has used empathy and understanding to coach teams to reach their full potential. She enjoys working in a collaborative environment and is passionate about learning. Connect with Amber on LinkedIn.
About Madi Fisher
Madi is an Agile Coach at Scaled Agile. She has many years of experience coaching Agile teams in all phases of their journeys. She is a collaborative facilitator and trainer and leads with joy and humor to drive actionable outcomes. She is a true galvanizer! Connect with Madi on LinkedIn.
SAFe® provides the strategic concepts and guidance that help steer transformations. And while the Framework metrics article focuses on high-level metrics like KPIs, OKRs, and strategic themes, some teams can struggle to contextualize SAFe metrics and measurement domains like flow, outcomes, and competency.
This is especially true for non-technical teams.
Even when metrics are captured, improvement areas might remain blurry without a shared understanding of what the metrics mean and show.
How do teams with different skill sets, business objectives, and types of work all use the same measurement domains to gauge success? How do they know if they are on track to achieve PI Objectives and Iteration Goals?
We asked Scrum Masters from five different teams to answer five questions about the metrics they use to measure flow, outcomes, and competency. Their answers were illuminating, and we’re excited to share the results in a new article series titled “SAFe Metrics for Teams.” Each article will highlight one or more teams and take a close look at how they use SAFe metrics in their own domains.
TEAMS SURVEYED
Sales Ops
Communications
Multimedia
Customer Success
Product Development
METRICS SURVEY QUESTIONS
What metrics does your team use to track outcomes?
How do these metrics help your team define and plan work?
What flow metrics does your team use?
How has your team used metrics to drive continuous improvement?
How does your team self-assess competency?
Let’s get started!
Applying SAFe® Metrics for a Sales Operations Team
Sales ops teams are charged with enabling the sales team to hit their growth targets. This means sales ops should do work that creates a better, faster, and more predictable sales process, including:
Lead management and routing
Database integrity
Enablement training
Sales team onboarding
Continued learning and development
Contract management solutions
Sales process optimization
Much more
By nature, sales ops work is often routine and process-heavy. It’s a lot of “run the business” or “business as usual” (BAU) work. Despite its sometimes repetitive nature, the pace and volume of this work will affect sales team objectives. Agile marketing teams are often in a similar position.
Plus, enterprise-level sales are getting more complicated. There’s more technology, data, tools, and systems than ever. For sales leaders, this complexity means spending more time managing systems and less time working with teams and growing territories. As sales teams face increasing pressure to become more customer-centric and responsive, the demand for Agility also grows.
How can sales ops teams embrace the same Agile spirit and practice that drives other business areas like development and IT? More specifically, how can a sales ops department employ measurements like flow, outcomes, and competency in the same way as other SAFe teams?
For Kate Quigly, a senior Scrum Master with the sales ops team, it starts with the right mindset and clear goals focused on helping sales teams embrace Agility in their planning and operations. We asked Kate to lift the lid on her team’s process for using metrics, pursuing improvement, and applying SAFe measurement domains. Below, Kate explains how the sales ops team makes SAFe guidance work for them.
OUTCOMES
Question: What metrics does your team use to track outcomes? How do these metrics help your team define and plan work?
Answer: Outcomes are the perfect opportunity to assess which work is worth doing and what value is delivered. Here are the metrics we use to measure outcomes:
PI Objectives
The nature of our work makes it fairly simple to craft SMART PI objectives. Here’s an example of a good PI objective for a typical sales ops team:
Example: “To grow strategic accounts by five percent in Q1 2023, create three account plans per region, and complete five live training sessions with sales by the end of Q4 2022.”
This objective would align with our team’s mission to bolster the sales team’s performance and operations in several ways:
It empowers sales to develop their account plans in the future. With this capability, sales can immediately take action to capture new opportunities in expanding regions.
It’s written to help sales achieve growth targets, which could be a strategic theme and/or PI Objective for the entire ART.
It enables future work that will contribute clear business value.
Team Business Value
Business value assignments are where we learn whether the right work was planned and completed correctly. We can use business value scores to understand the following:
Did we plan the right mix of work? For us, this could mean uncovering the wrong balance of BAU work vs. “user-facing” projects.
Were we able to complete our committed objectives? If not, why?
Were our objectives clear and measurable?
Are we delivering value?
Iteration Goals
Iteration goals keep us focused on the most important work. Because iteration goals are not always reflected in a single story, we can check each iteration to see if visible work is actually contributing to our iteration goals (and PI Objectives). We want to discover if completed stories actually support the iteration goals. If there’s misalignment here, and we’re planning proper capacity, trouble could be around the corner.
Team Purpose Statement
While objective metrics are critical, qualitative assessments also matter. We often refer to our team purpose statement to check whether planned work needs to be rephrased, reexamined, or re-scoped to align with our core purpose.
FLOW
Question: What flow metrics does your team use?
Answer: Since we’re a relatively new team, we’re still honing the best set of metrics. I recommend using a variety of metrics as each one can highlight valuable insights. Right now, we use the following metrics most often:
Flow Velocity
Team velocity should be a stable, predictable measurement that helps the team forecast capacity for future work. Velocity metrics should never be compared across teams or used as a productivity measurement. Too much emphasis on achieving the right number can cause teams to “game” the system.
I use some standard questions to spark conversations, including:
Is our team velocity significantly dropping? Let’s discuss why.
Is our team velocity significantly increasing? What’s the cause of this increase?
In particular, we look at the number of rollover stories from one iteration to the next. The root cause of these rollover stories can reveal issues with prioritization, role competency, and dependencies. This analysis helped our team discover a missing toolset needed for data management work.
Flow Time
We use cycle time scatterplot charts to show lead time and cycle time. These charts capture when an item starts and finishes. Low cycle time means the team is performing well and value flows fast to customers. Items with high cycle time are easy to identify and retrospect on.
Measuring flow time helped us find a recurring delay within the legal department. The delay caused an issue with generating new contracts, which are critical for our internal customers (sales) to finalize their work within a fixed timeline.
This data helps us talk about problems in a new way by asking the following:
Why did some items take so long to complete? What could we have done differently? Are there action items we can do to improve?
Our average time to finish an item is X amount of days. What improvements would lower this for even more efficiency?
Flow Distribution
Distribution is crucial for understanding whether we’re spending time on the right mix of work types. The team believes (rightly) that BAU work should be shown and recognized. Common BAU work includes:
Analyze closed lost/won deals
Data cleanup
Contract updates
Onboarding/offboarding tasks
Training, onboarding, and enablement
However, I’ve had to coach the team on how to incorporate this type of work into Scrum, and how to balance BAU with “new development” work, which we affectionately call “special projects.” For our team, special projects would include work like:
Salesforce automations
New system implementation for key account management
For us, all of these metrics roll up into two primary dashboards. We frequently use the following charts to check our progress:
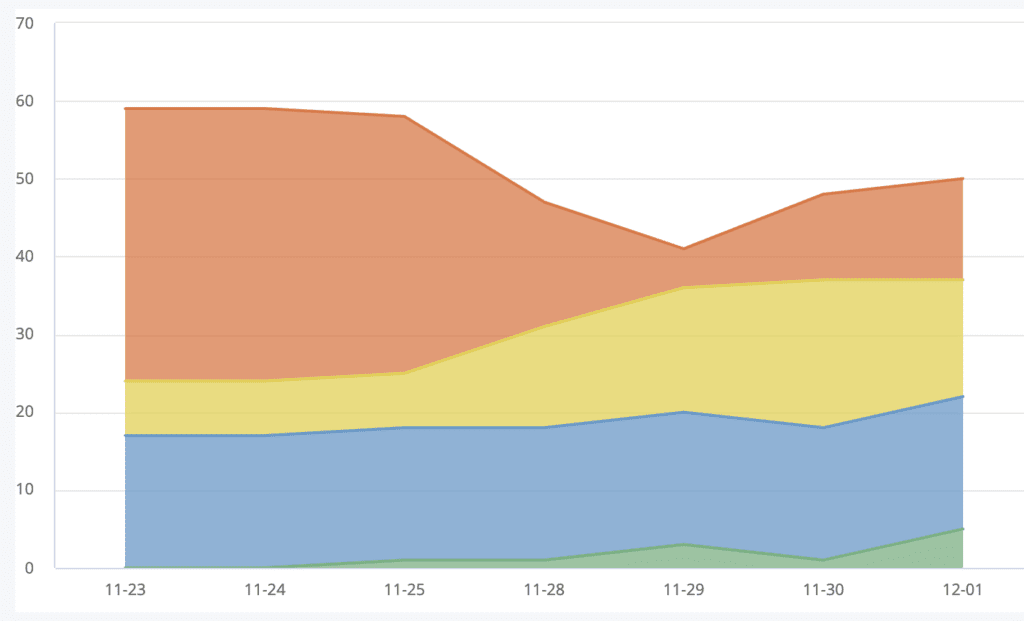
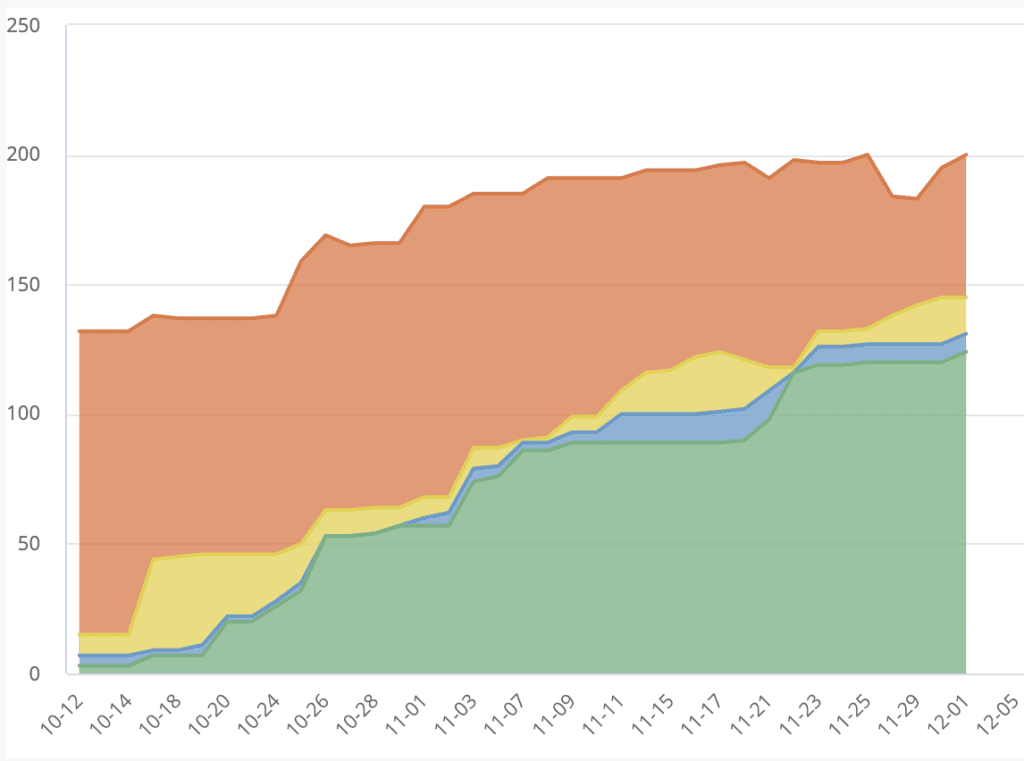
Iteration cumulative flow diagram
Release cumulative flow diagram
Burndown chart
Iteration and Release cumulative flow diagrams help visualize the work. These diagrams show cycle time, work in progress, and throughput.
This metric surfaced an interesting “stair step” pattern, which could indicate rushing at the end of the iteration. Once identified, we were able to find some key bottlenecks that are unique to the sales environment.
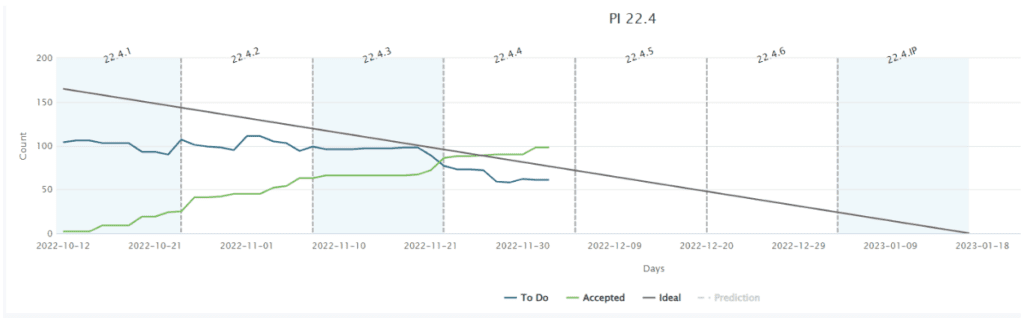
Burndown charts. These charts can predict the team’s likelihood of completing the committed work in a given time period. By visualizing the work in this way, you can see if delivery is on track, will complete early, or will be delayed.
Question: How has your team used metrics to drive continuous improvement?
Answer: These metrics help us identify mistakes, whether it’s a missed dependency, unclear acceptance criteria, or errant planning. For example, I’ve seen our team continually battle context switching, indicated by a large amount of work in progress (WIP).
The context switching was causing us to miss more meaningful opportunities. For sales ops, this could mean putting new dashboards on hold and instead prioritizing new account research. During team retros, we can use questions like the following to identify improvement areas:
Are there too many items “in progress” which can result in costly context switching?
Are there too many items “in progress” which can signal a bottleneck problem in our workflow?
Is there a large amount of work that is “not started” that may cause us to delay or miss upcoming milestones?
Improvements tested:
Stop starting and start finishing by limiting WIP
Swarming or pairing to complete work faster
Teams identify and embrace metrics depending on how you set the stage and approach these conversations. Again, for us, the priorities are clarified by focusing on the most valuable work instead of giving all planned work the same priority level. We must continually ask: “what’s the most value we can deliver this week, this iteration, and this PI?”
COMPETENCY
Question: How does your team self-assess competency?
Answer: As a new team, we’re focused on the team and technical agility assessment, which was just distributed to the team. I am very excited to use this as another tool to start team conversations about improvement areas.
Bonus Tips
Kate shared a few other key ways that sales ops teams can “think” Agile and adapt SAFe practices to their business domain:
Will the planned work allow sales team members to be more decentralized, productive, and empowered in their job?
Is the planned work only planned because “that’s the work we do”?
What work would support cross-functional capabilities for sales teams/members?
Example: A standardized sales deck with editable fields to eliminate dependence on graphic design support.
What processes can be automated to create economies of scale?
Example: An automated, repeatable de-duplication process for faster and more accurate CRM data management.
Overall, changing their way of thinking about work and measuring value has helped the sales ops team embrace Agile principles and improve alignment across the ART. As a result, they have better tools for visualizing, categorizing, and prioritizing BAU work with critical projects while also seeing the real value they deliver.
About Kate Quigly
Kate is a Senior Scrum Master at Scaled Agile, Inc. She has many years of experience coaching Agile teams with high energy and creativity. She is passionate about lifelong learning, experimenting with teams, and creating a collaborative culture. Connect with Kate on LinkedIn.
About Madi Fisher
Madi is an Agile Coach at Scaled Agile. She has many years of experience coaching Agile teams in all phases of their journeys. She is a collaborative facilitator and trainer and leads with joy and humor to drive actionable outcomes. She is a true galvanizer! Connect with Madi on LinkedIn.