AgilityHealth Insights: What We Learned from Teams to Improve Performance – Agility Planning

This post is part of an ongoing blog series where Scaled Agile Partners share stories from the field about using Measure and Grow assessments with customers to evaluate progress and identify improvement opportunities.

At AgilityHealth®, our team has always believed there’s a correlation between qualitative metrics (defined by maturity) and quantitative metrics (defined by performance or flow). A few years ago, we moved to gather both qualitative and quantitative data. Once we felt we had a sufficient amount to explore, we partnered with the University of Nebraska’s Center for Applied Psychological Services to review the data through our AgilityHealth platform. The main question we wanted to answer was: What are the top competencies driving teams to higher performance? 

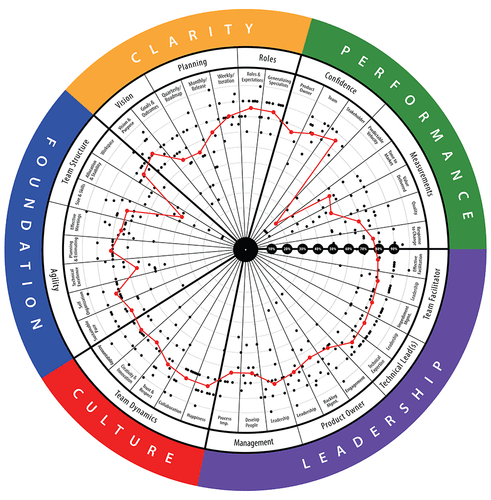
Before we jump into the data, let’s start by reviewing what metrics make up “performance.” Below are the five quantitative metrics that form the Performance Dimension within the TeamHealth® radar: 

  • Time-to-market 
  • Quality
  • Predictable Delivery
  • Responsiveness (cycle time)
  • Value Delivered
AgilityHealth

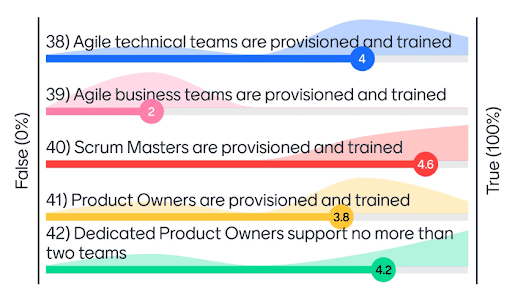
During the team assessment, we ask the team and the product owner about their happiness and their confidence in their ability to meet the current goals. We consider these leading indicators for performance, so we were curious to see what drives the qualitative metrics of Confidence and Happiness as well. 

Methodology 

We analyzed both quantitative and qualitative data from teams surveyed between November 2018 and April 2021. There were 146 companies representing a total of 4,616 teams (some who took the assessment more than once) which equates to more than 46,000 individual survey responses.

We used stepwise regression to explore and identify the top five drivers for each outcome. Stepwise regression is one approach in building a model that explains the most predictive set of competencies for the desired outcome. 

The results of our analysis identified the top five input drivers for each of the performance metrics in the TeamHealth assessment, along with the corresponding “weight” of each driver. We also uncovered the top five drivers of Confidence and Happiness for teams and product owners. These drivers are the best predictors for the corresponding metrics. All drivers are statistically significant, and each metric has the driver’s ranked order. 

By focusing on increasing these top five predictors, teams should see the highest gain on their performance metrics. 

Results

 After analyzing the top drivers for each of the performance metrics, we noticed that a few kept showing up as repeat drivers across performance. 

AgilityHealth

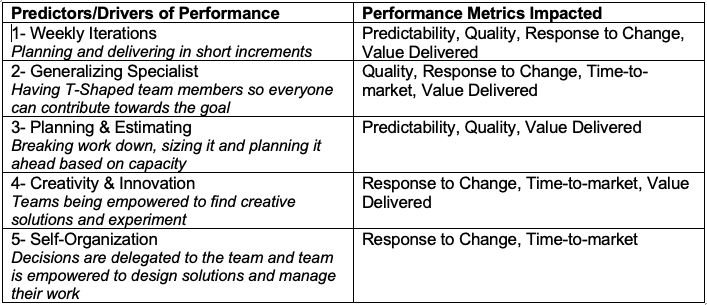
When analyzing the drivers for Confidence and Happiness, we found these additional predictors:

AgilityHealth

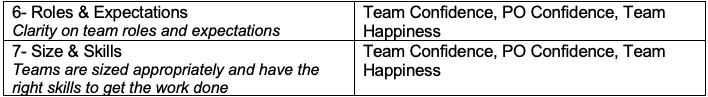
We know from experience that shorter iterations, better planning and estimating, and T-shaped skills all lead to better performance—but we now have data to prove it. It was a welcome surprise to see self-organization and creativity take center stage, as it did in our analysis. We’ve always coached managers to empower teams to solve problems, but for the first time, we have the data to back it up. 

Recommendations

Pulling these patterns together, it’s clear that if a team wants to impact its performance in an efficient way, it should focus on weekly iterations, T-shaped team members, effective planning and estimating, enabling creativity and self-organization, role clarity, and right-sizing and skilling. Teams that invested in these drivers saw a 37 percent performance improvement over teams that didn’t. So when in doubt, start here!

We’re excited to share that you can now see the drivers for each competency inside the AgilityHealth platform. We hope it helps you make informed decisions about where to invest your time and effort to improve your performance.

Visit the AgilityHealth page on the SAFe® Community Platform to learn more about these assessment tools and get started!

About Sally

Sally- Agile and business agility space

Sally is a thought leader in the Agile and business agility space. She’s passionate about accelerating the enterprise business agility journey by measuring what matters at every level and building strong leaders and strong teams. She is an executive advisor to many Fortune 500 companies and a frequent keynote speaker. Learn more about AgilityHealth at https://www.agilityhealthradar.com.

Share:

Back to: All Blog Posts

Next: How Do We Measure Feelings?

Honest Assessments Achieve Real Insights

In this post, I share my experience of running a series of Measure and Grow assessments at a government agency in the UK I’m working with—including the experiments that we decided to run and our learnings during the SAFe transformation process.

The last year has been a voyage of discovery for all of us at Radtac. First, we had to figure out how to deliver training online and still make it an immersive learning experience. Then, we needed to figure out how to do PI Planning online with completely dispersed teams. Once that was sorted, we entered a whole new world of ongoing, remote consulting that included how to run effective Measure and Grow assessments.

In this post, I share my experience of running a series of Measure and Grow assessments at a government agency in the UK I’m working with—including the experiments that we decided to run and our learnings. The agency has already established and runs 15 Agile Release Trains (ARTs). We agreed that we wouldn’t run assessments for 15 ARTs because we wanted to start small and test the process first. Therefore, we picked four ARTs to pilot the assessments and only undertake the Team and Technical Agility and Agile Product Delivery assessments.

Pre-assessment Details

What was really important was that each ART we had selected had an agility assessment pre-briefing where we set the context with the following key messages:

  1. This is NOT a competition between the ARTs to see who had the best assessment.
  2. The assessments will support the LACE in identifying the strengths and development areas across the ARTs.
  3. The results will be presented to leadership in an aggregated form. Each ART will see only their results; no individual ART results will be shared with other ARTs.
  4. The results will identify where leadership can remove impediments that the teams face.
  5. We need an honest assessment to achieve real insight into where leadership and the LACE can help the teams.

In addition, prior to the assessments, we asked the ARTs to:

  1. Briefly review the assessment questions.
  2. Prioritise attendance with core team members with a cross-section of their team.

Conducting the Assessment

The assessment was facilitated by external consultants to provide some challenges to the responses. We allotted 120 minutes for both the Technical and Team Agility and Agile Product Delivery assessments, but most ARTs completed them within 90 minutes. We used Microsoft Teams as our communication tool and Menimeter.com (Menti) to poll the responses.

Each Menti page had five to six questions that the team members were asked to score on a scale of 1 to 5–with 1 being false, 3 being neither false nor true, and 5 is true. To avoid groupthink, we didn’t show the results until all questions and all members had been scored. Because Menti shows a distribution of scores, where there was a range in the scoring, we explored the extremes and asked team members to explain why they thought it was a 1 while others thought it was a 5. On the rare occasion that there was any misunderstanding, we ran the poll again for that set of questions.

Scaled Agile Partners
Some results from the Team and Technical Agility poll.

What we found after the first assessment was that there was still a lot of SAFe® terminologies that people didn’t understand. (Based on this and similar feedback, Scaled Agile recently updated its Business Agility assessment with simpler, clearer terminology. This is helpful for organizations that want to use it before everyone has been trained or even before they’ve decided to adopt SAFe.) So, for the next assessment, we created a glossary of definitions, and for each set of questions before they scored, we reminded them of some of the key terminology definitions.

Terminology clarifications

The other learning was that for some of the questions, team members didn’t have a particular experience, and therefore scored a 1 (false) which distorted the assessment. Going forward, we asked team members to skip the question if they had no experience. We also took a short break between the assessments. And of course, no workshop would be complete without a feedback session at the end, which helped us improve each time we completed the assessments.

Here is a quote from one of the ARTs:

“As a group, we found the Agile Assessment a really useful exercise to take part in. Ultimately, it’s given our supporting team areas to focus on and allowed us to pinpoint areas where we can drive improvements. The distributed scores for each question are where we saw a great deal of value and highlighted differences in opinion between roles. This was made more impactful by having a split of engineers and supporting team roles in the session. The main challenge we had about the session was how we interpreted the questions differently. To overcome this, we had a discussion about each question before starting the scoring, and although this made the process a little longer, it was valuable in ensuring we all had the same understanding.”

Post-assessment Findings

We shared the individual ART results with its team members so that they could consider what they as an ART could improve themselves. As a LACE, we aggregated the results and looked for trends across the four ARTs. Here’s what we presented to the leadership team:

  1. Observations—what did we see across the ARTs?
  2. Insights—what are the consequences of these observations?
  3. Proposed actions—what do we need to do as a LACE and leadership team? We used the Growth Recommendations to provide some inspiration for the actions.

We then made a commitment to the teams that we would provide feedback from the leadership presentations.

Next Steps

We need to run the assessments across the other 11 ARTs and then repeat the assessments every two to three Program Increments.

You can get started with Measure and Grow, including the updated Business Agility assessment and tools on the SAFe® Community Platform.

About Darren Wilmshurst

Darren Wilmshurst

Darren Wilmshurst is a director at Radtac, a global agile consulting business based in London that was recently acquired by Cprime. As an SPCT and SAFe® Fellow, Darren is an active agile practitioner and consultant who frequently delivers certified SAFe courses. Darren also serves as treasurer of BCS Kent Branch and co-authored the BCS book, Agile Foundations—Principles, Practices and Frameworks.

Share:

Back to: All Blog Posts

Next: Creating Your PI Backlog Content