Editor’s Note: You’re facing unprecedented business challenges. You need more than theories—you need a blueprint. Welcome to a Leader’s Blueprint, your weekly guide to proven strategies that get results.
You’re in the quarterly strategy meeting. The stakes are high, and a critical decision must be made: which major initiative should be prioritized for funding? The debate is passionate, but it’s driven by compelling arguments and seniority, not data. You have dashboards, but they’re filled with vanity metrics. No one can definitively answer the most important question: “Which of these options will actually move the needle on our business goals?”
When the loudest voice in the room becomes your primary decision-making tool, you’re not strategizing; you’re gambling.
What is a Data-Driven Product Strategy?
A data-driven product strategy is one that relies upon product analytics and qualitative insights to inform decision-making and which direction you should take your products in.
It’s a product management and development approach that aims to improve strategy by ensuring it’s driven by a comprehensive understanding of product usage based on concrete information and evidence, such as usage patterns, customer behavior, and performance metrics, rather than guessing what should be done next using assumptions or intuition.
The Hidden Costs of an Opinion-Driven Culture
Operating without clear, consistent product metrics is like flying a plane without an instrument panel. The risks are immense and go far beyond inefficient meetings:
Strategic Drift
Teams invest significant time and effort into features that feel important but are never tied back to defined outcomes. Over time, this disconnect causes the product to slowly drift away from its original goals and customer needs, as well as market position. Without data to course-correct and identify areas for improvement, even well-intentioned work can pull the product in conflicting directions.
Wasted Investment
When priorities aren’t grounded in measurable impact, precious capital and talent are spread thin across initiatives that don’t really make a difference. Engineering time, design effort, and marketing spend are consumed by features or experiments that fail to improve business performance or user experience and satisfaction. And this is often done without anyone realizing the true cost.
Inability to Learn
Without measuring the results of decisions, product teams lose the ability to learn from their work. Every launch becomes a shot in the dark, with no feedback loop to indicate success or failure. This prevents continuous improvement, making it difficult to refine strategy or build confidence in future decisions.
Slower Decision-Making
In the absence of data, decisions rely heavily on debate to try to reach a consensus. This leads to prolonged discussions and decision paralysis. Instead of moving quickly with clarity, teams spend time defending opinions rather than aligning around evidence and quantitative data.
Erosion of Trust and Alignment
When decisions are driven by opinion, stakeholders often question why certain choices were made. This can erode trust between teams and leadership, which creates friction across functions and makes it harder to align around a shared vision. Product development guided by the right data provides a common language; Without it, alignment becomes fragile and short-lived.
Data-Driven Product Management: From Guesswork to Guidance
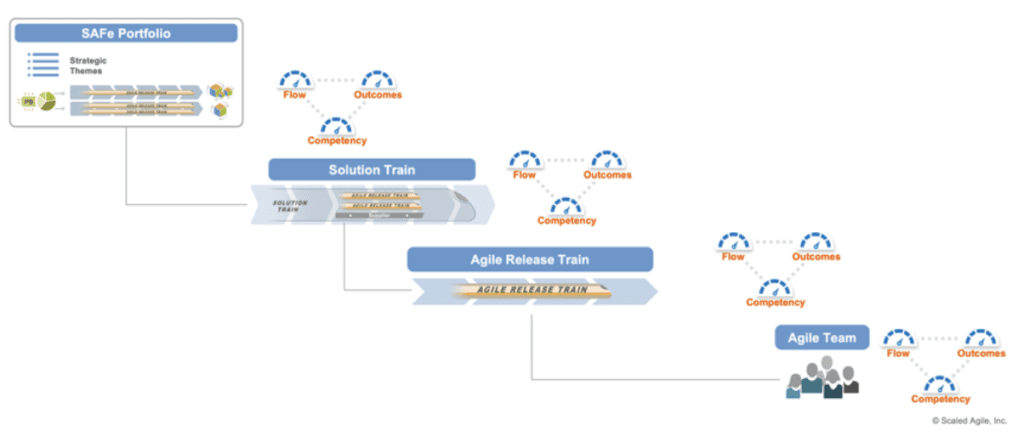
The antidote to this uncertainty is building a culture of data-driven decision-making. In SAFe®, this is guided by the Measuring Product Performance competency. This framework provides clarity by viewing your product through four essential lenses: Business Outcomes, User Engagement, Customer Satisfaction, and Technical Performance.
This holistic view is powered by combining two types of metrics:
- KPIs (Key Performance Indicators): hese are your instruments, providing a continuous pulse-check on the operational health of your product.
- OKRs (Objectives and Key Results): This is your destination, aligning everyone toward ambitious, strategic goals.
Using both, you always know your current health and where you’re headed.
Benefits of Using Product Data to Make Strategic Decisions
Product management data analytics help PMs in several ways:
Enable Better Product Decisions for Product Managers
For a product manager, data provides the foundation for confident prioritization. By relying on key data instead of intuition alone, teams can optimize product decisions, focusing effort on initiatives that deliver the greatest value to users and the business.
Leverage Data Analysis to Move Faster with Confidence
Strong data analysis helps teams to reduce uncertainty and accelerate decision-making. When evidence is readily available, discussions become more focused, alignment happens faster, and teams can make data-driven decisions without unnecessary debate.
Create a Data-Driven Culture with Shared Metrics
Shared metrics help create a data-driven culture where teams align around outcomes instead of opinions. This common language enables better collaboration across functions and ensures everyone is working toward the same strategic goals.
Reduce Risk and Waste
When teams use product data effectively, they can identify underperforming initiatives early. This reduces risk and avoids wasted investment. It also ensures resources are allocated based on evidence rather than guesswork.
Support a Strategy Framework with Transparency and Accountability
An effective strategy depends on having a clear view of how the product is performing. When decisions are grounded in measurable outcomes, it becomes easier to understand the reasoning behind them and assess their impact over time. This shared visibility helps teams stay aligned and reinforces ownership of decisions. What’s more, it allows strategic choices to be evaluated and refined over time.
How to Use Data to Drive Product Growth and Actionable Insights
Start With a Clear, Measurable Question
You can begin this shift with a single question. This week, pick one significant feature on your upcoming roadmap and ask the team:
“If this feature is wildly successful, which single, measurable metric will change, and in what direction?”
If there isn’t a clear answer, the feature’s purpose—and its value—is a mystery.
Define Meaningful Metrics
Metrics should tell you something important about your product, not just fill a report. Think about engagement, retention, revenue impact, or operational efficiency—whatever shows real customer value. The key is choosing measures that are specific and actionable. They should be directly tied to decisions, so you always know which levers to pull next.
Integrate Metrics Into a Strategy Framework
Undertaking the first two steps above brings immediate clarity. But creating a true data-driven engine requires a complete system. The Measuring Product Performance competency provides a full blueprint for defining meaningful metrics across all four lenses and integrating them into powerful OKRs and KPIs. Stop flying blind. Unlock the full framework, competencies, and guidance you need to make every product decision with confidence. Get access by purchasing your SAFe® Insider membership today.
Continuously Measure and Adjust
Data isn’t a one-time check; it’s a constant feedback loop. Track results for every launch, experiment, or update, then analyze what’s working and what’s not. Use these insights to refine priorities, validate assumptions, and make smarter decisions for the next round of features. Your product evolves with each insight.
Embed a Data-Driven Culture
A data-driven strategy only works if the team lives it. Encourage using metrics in discussions and planning. Share results openly to celebrate wins and learn from misses. Over time, using data becomes second nature, helping everyone make better decisions and keeping the product aligned with real customer needs.

Scaled Agile: Helping You Use the SAFe Framework to Make Data-Driven Decisions
Embrace the full power of the SAFe Framework, with the competencies and guidance that will empower you to become truly customer-centric and unlock your organization’s full potential. Get complete access by purchasing your
SAFe Insider membership today.
In this Series:
- Catch up on last week’s post: The Sound of Silence: When a Lack of Customer Feedback Derails Your Strategy
- Coming next week: Creating Responsive Roadmaps
1 According to the McKinsey Global Institute, as cited on the Data Ideology website, “Data-Driven Organizations Are 23 Times More Likely to Acquire Customers, Six Times as Likely to Retain Customers, and 19 Times as Likely to Be Profitable as a Result”. Retrieved on October 22, 2025, https://www.dataideology.com/data/data-driven-organizations-are-23-times-more-likely-to-acquire-customers-six-times-as-likely-to-retain-customers-and-19-times-as-likely-to-be-profitable-as-a-result/